
Neurolabs
2026 Strategic Series

Retail Execution
Intelligence.

The four strategic levers transforming CPG growth, a guide for Sales, RGM and commercial leaders closing the gap between what is planned and what reaches the shelf.

For VP Sales · Director Trade · VP RGM
Verticals Beer & Spirits · Soft Drinks · Energy · Snacking
Read time 22 minutes
Download the PDF
neurolabs.ai Execution Intelligence
Foreword A message from our Co-Founder

The gap between commercial strategy and in-store reality has never been more costly or more visible.

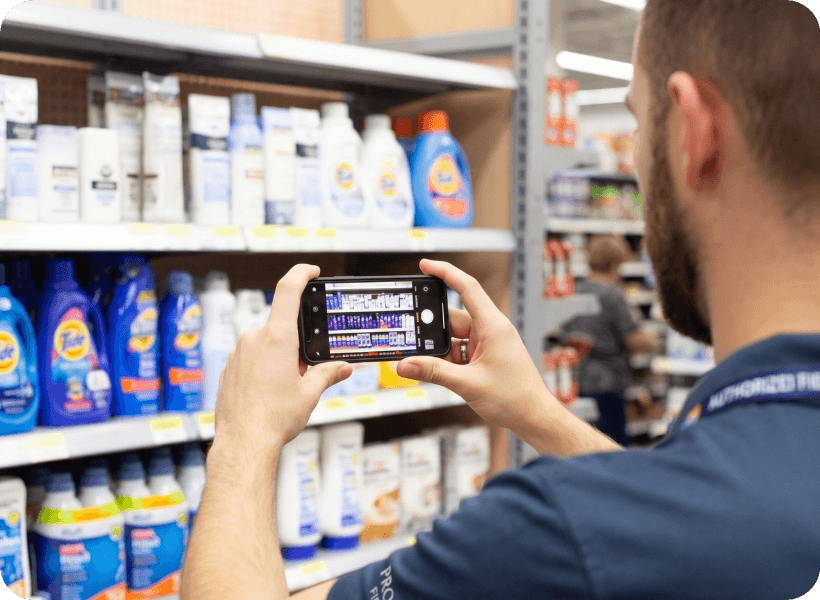
A field representative capturing a shelf with a phone
A single shelf photo is all the input Execution Intelligence needs.

CPG companies invest billions every year in trade promotions, seasonal activations and retail execution programmes. The plans are sophisticated. The field teams are talented. The trade investment is significant. But for most brands, the fundamental question remains unanswered: did what we planned actually happen in-store?

Retail environments have become more complex, more competitive and more consequential. SKU counts have exploded. Promotional windows have compressed. Retailer expectations have intensified. And the cost of a single missed execution week during a peak commercial moment can reach seven figures in lost volume.

The problem is not execution intent. It is visibility. Most brands are operating on data that is days or weeks old by the time it reaches the commercial team. They find out what went wrong in the post-mortem, after the revenue has already been lost.

Execution Intelligence changes that. By connecting store-level visual data to commercial decision-making in near real time, brands can finally see what is happening in their stores while there is still time to act.

The brands that close this gap first will have a structural advantage. The ones that do not will keep explaining shortfalls after the window has closed.

Remus Pop Co-Founder & CRO, Neurolabs
Chapter 01 The Execution Gap

The retail execution gap is measurable and it is costing revenue.

Every year, CPG companies set ambitious commercial plans. Promotions are designed, display specifications are agreed with retailers, pricing architecture is set at headquarters, field teams are briefed and deployed. And then the execution window opens. What actually happens next is rarely captured in real time.

The scenario every commercial leader knows

A six-week post-mortem on a campaign that was lost in week one.

By the time field reports arrive at headquarters, the execution window has often already closed. A product launch has come and gone. A promotional price has been incorrect for three weeks before anyone noticed. A display was never put up, or went up wrong, in ten of the brand's top twenty stores. The POS data shows a dip in volume. But no one can say whether it was low demand or an execution failure.

Consider a major beverages brand running a Q3 summer activation across 5,000 convenience stores. 20% of stores do not execute the display correctly. 10% price the promotion incorrectly. 15% are out of stock on the hero SKU at peak demand. The brand finds out, from a monthly field report, six weeks after the window closes. By that point, nothing can be fixed. The revenue has already been lost.

The retail execution gap is not a field performance problem. It is a visibility problem. The data needed to close it exists, it just is not reaching commercial leaders while they can still act on it.
8–10%
Average OOS rate in CPG
Out-of-stock rates remain persistently high despite significant supply chain investment.
<80%
Typical promo compliance
In large-format retail, promotional compliance rarely exceeds 80%. In convenience it is harder still.
4–6wk
Average data lag
Time between an execution failure occurring and the commercial response. The window has closed.

The execution failure inventory.

The range of failures that go undetected, or detected too late, is wider than most commercial teams realise.

Retail shelf with visible out-of-stock gaps and out-of-stock tags
Out of stockEmpty facings during trading hours. In POS data this often reads as low demand, and the replenishment trigger never fires.

01Promotional non-compliance

Display specifications agreed with a retailer do not match what actually went on the floor. The mechanic runs, but not at the agreed volume or prominence.

02Pricing inaccuracy

Shelf edge prices do not reflect the agreed promotional price. Promo leakage, competitor repricing or simple error means the brand's pricing strategy is not what the shopper sees.

03Out-of-stocks

Products are listed, ordered, even delivered, but gaps appear on the shelf that are not captured until the next visit. Often misread as low demand in POS data.

04Phantom inventory

System records show product on-hand, but the shelf is empty. The replenishment trigger never fires because the inventory gap has not been identified.

05Planogram deviation

Products are positioned incorrectly, competitor brands encroach on negotiated space, or secondary placements miss agreed execution standards.

06Competitor encroachment

Rivals gain more shelf space than agreed, or promotional activity appears at locations that undermine the brand's own activation, without anyone at HQ knowing.

Chapter 01 (cont.) The data problem underneath it all

Four data flows. Every one of them has a structural blind spot.

The execution gap persists not because of a lack of data, but because of a lack of timely, actionable data.

POS & sell-out data

Tells you what sold, but cannot distinguish between low demand and execution failure. A dip in Chicago could be a demand signal, or a missing display.

×

Field sales force reports

Rich in context, but inconsistent by nature. By the time notes are compiled, the window has often closed and the picture was never objective in the first place.

×

TPM & SFA platforms

Excellent for planning and task management. Structurally weak on real-time shelf reality.

×

Manual audits

Expensive, infrequent and subject to significant sampling bias. Accurate for the day of the visit and little else.

×

None of these data sources, individually or in combination, gives a commercial leader what they actually need: a near real-time view of what is happening at the shelf, in every store that matters, while there is still time to act.

Chapter 02 The Execution Intelligence Framework

Turning store-level data into commercial action, in near real time.

The retail execution gap is not inevitable. It persists because the data that would close it has historically been too slow, too expensive, or too fragmented to be commercially useful. Execution Intelligence changes the equation.

Execution Intelligence is the real-time connection between what CPG brands plan commercially and what actually happens on the shelf, transforming store-level visual data into operational insight, commercial action and measurable revenue impact.

Legacy shelf tools answer

"What is on the shelf?"

Execution Intelligence answers

"Is my execution driving the commercial outcomes I planned for and what do I need to do about it, right now?"

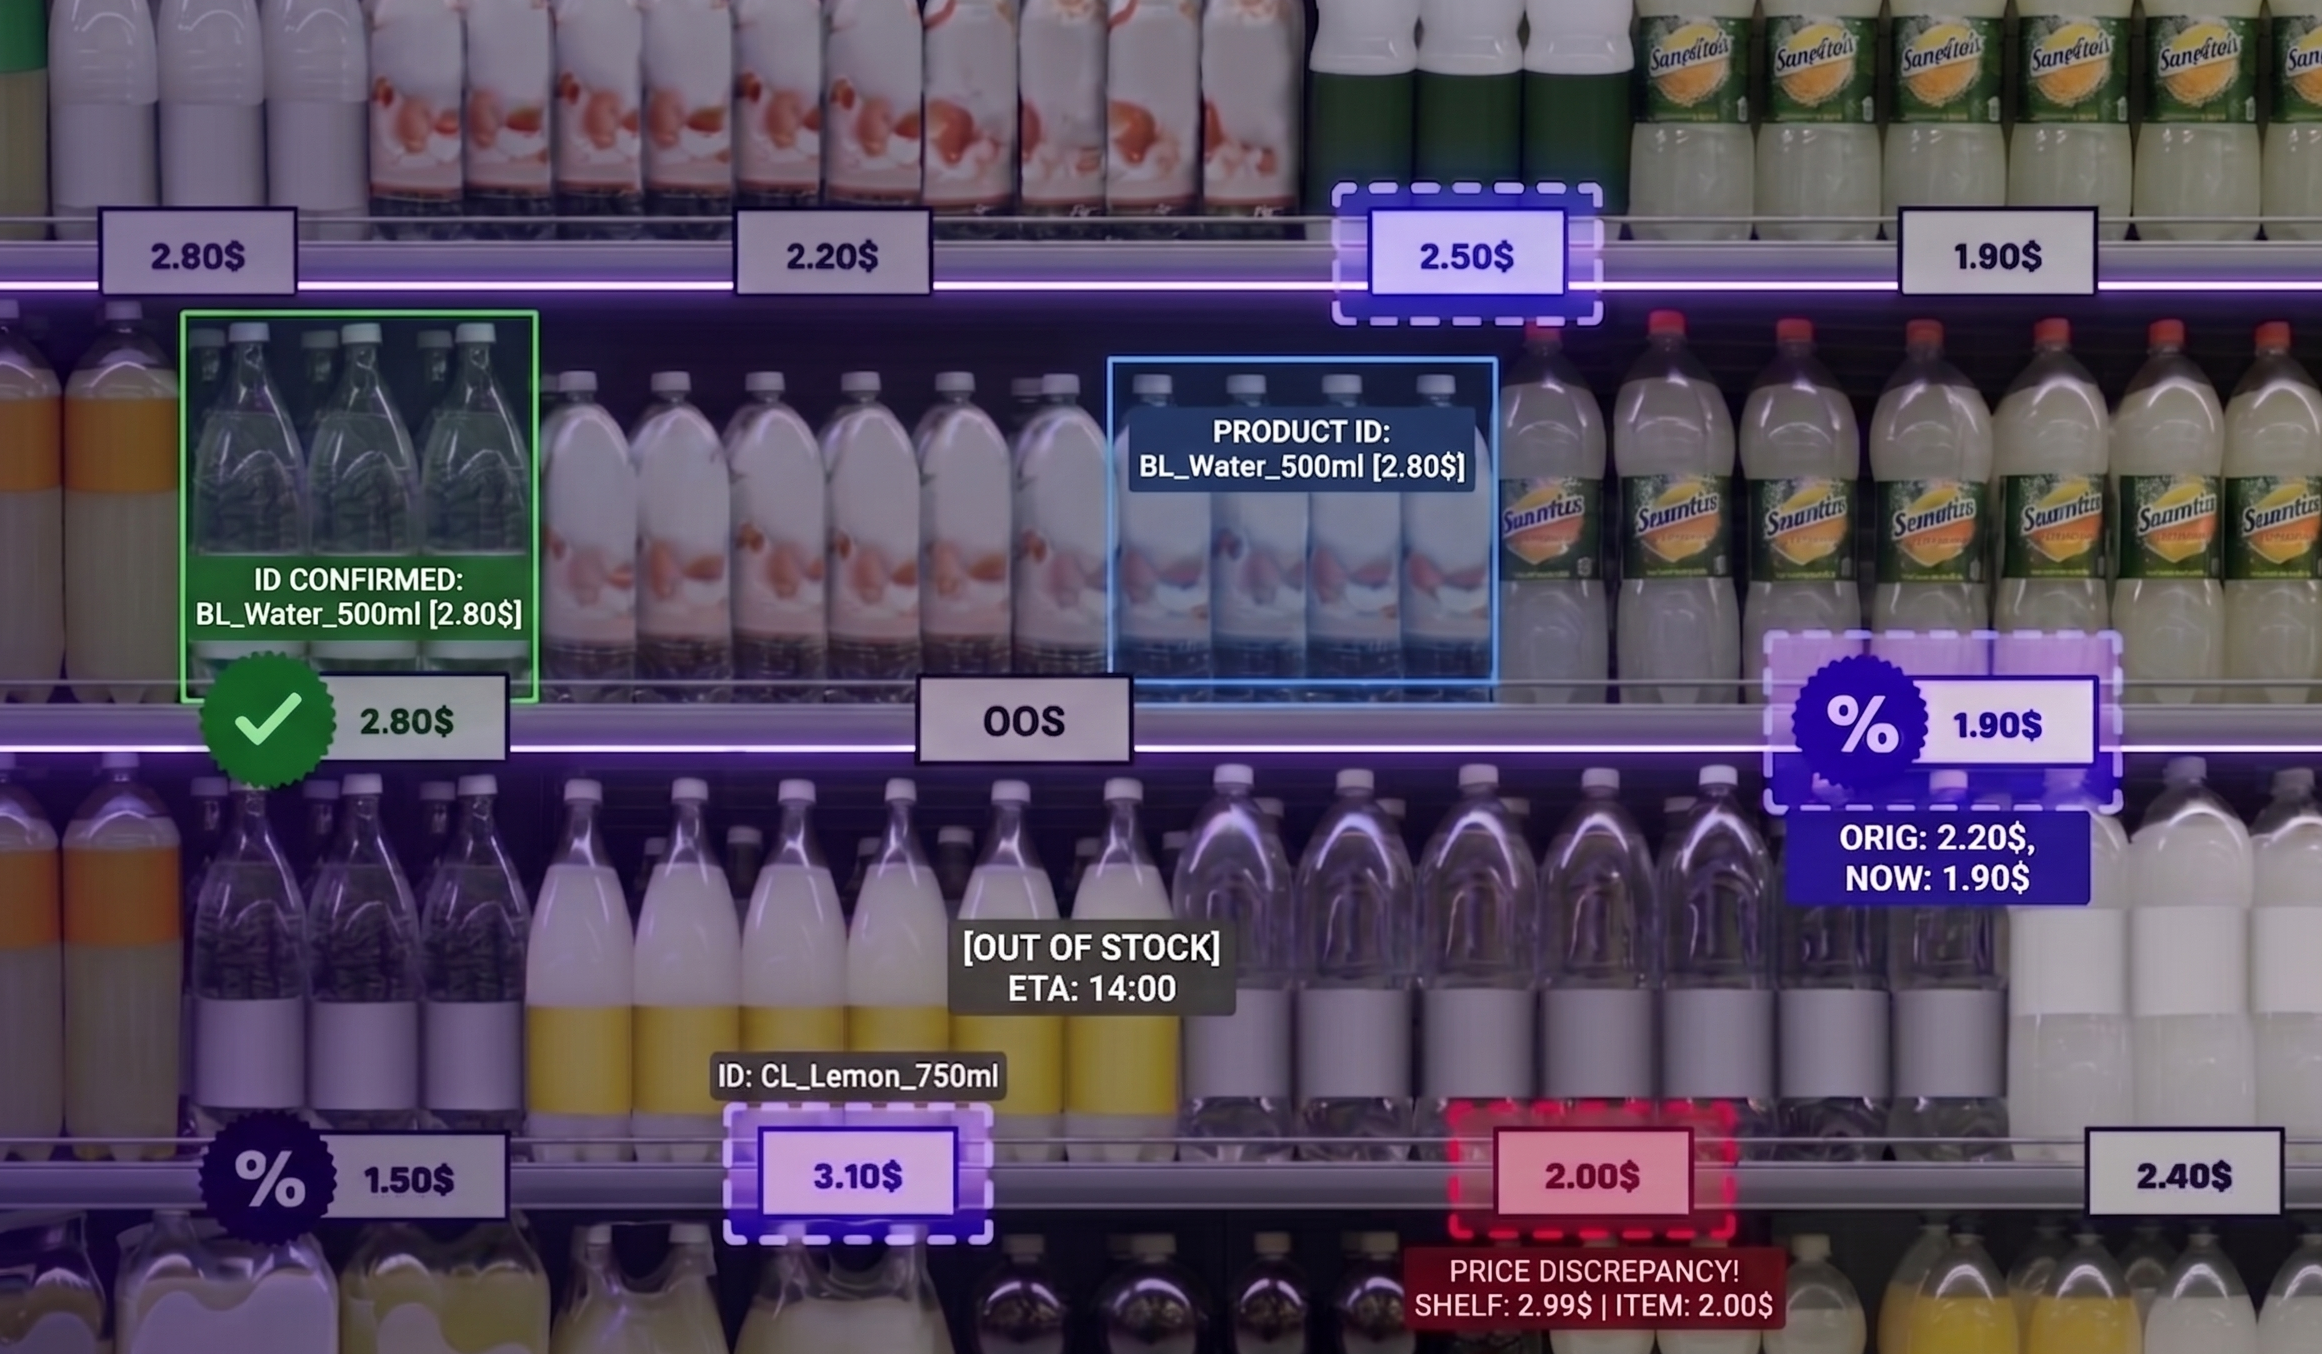
Shelf image with product IDs, out-of-stock and price-discrepancy overlays
Structured outputOne image, read in near real time: every SKU identified, an out-of-stock flagged, a price discrepancy caught against the shelf tag.

The four-stage execution cycle.

Execution Intelligence operates as a continuous improvement loop. Each pass generates the intelligence needed to improve the next.

Stage 01 · Data

Capture.

Store-level visual data is captured through field team photos, partner networks, or crowdsourced images, a structured, near real-time feed of shelf conditions across the full store estate.

Stage 02 · Insight

Structure.

Raw data becomes structured intelligence: SKU presence, promotional compliance, share-of-shelf, pricing accuracy, planogram adherence, competitor activity. Actionable context, not a report.

Stage 03 · Action

Act.

Insights surface in near real time to the people who can act on them. Next best actions recommended. Alerts fire when thresholds are breached. The execution window stays open.

Stage 04 · Impact

Measure.

Execution changes are tracked and their commercial outcomes are measured. Did fixing the display in Chicago move volume? The loop closes and every pass makes the next one smarter.

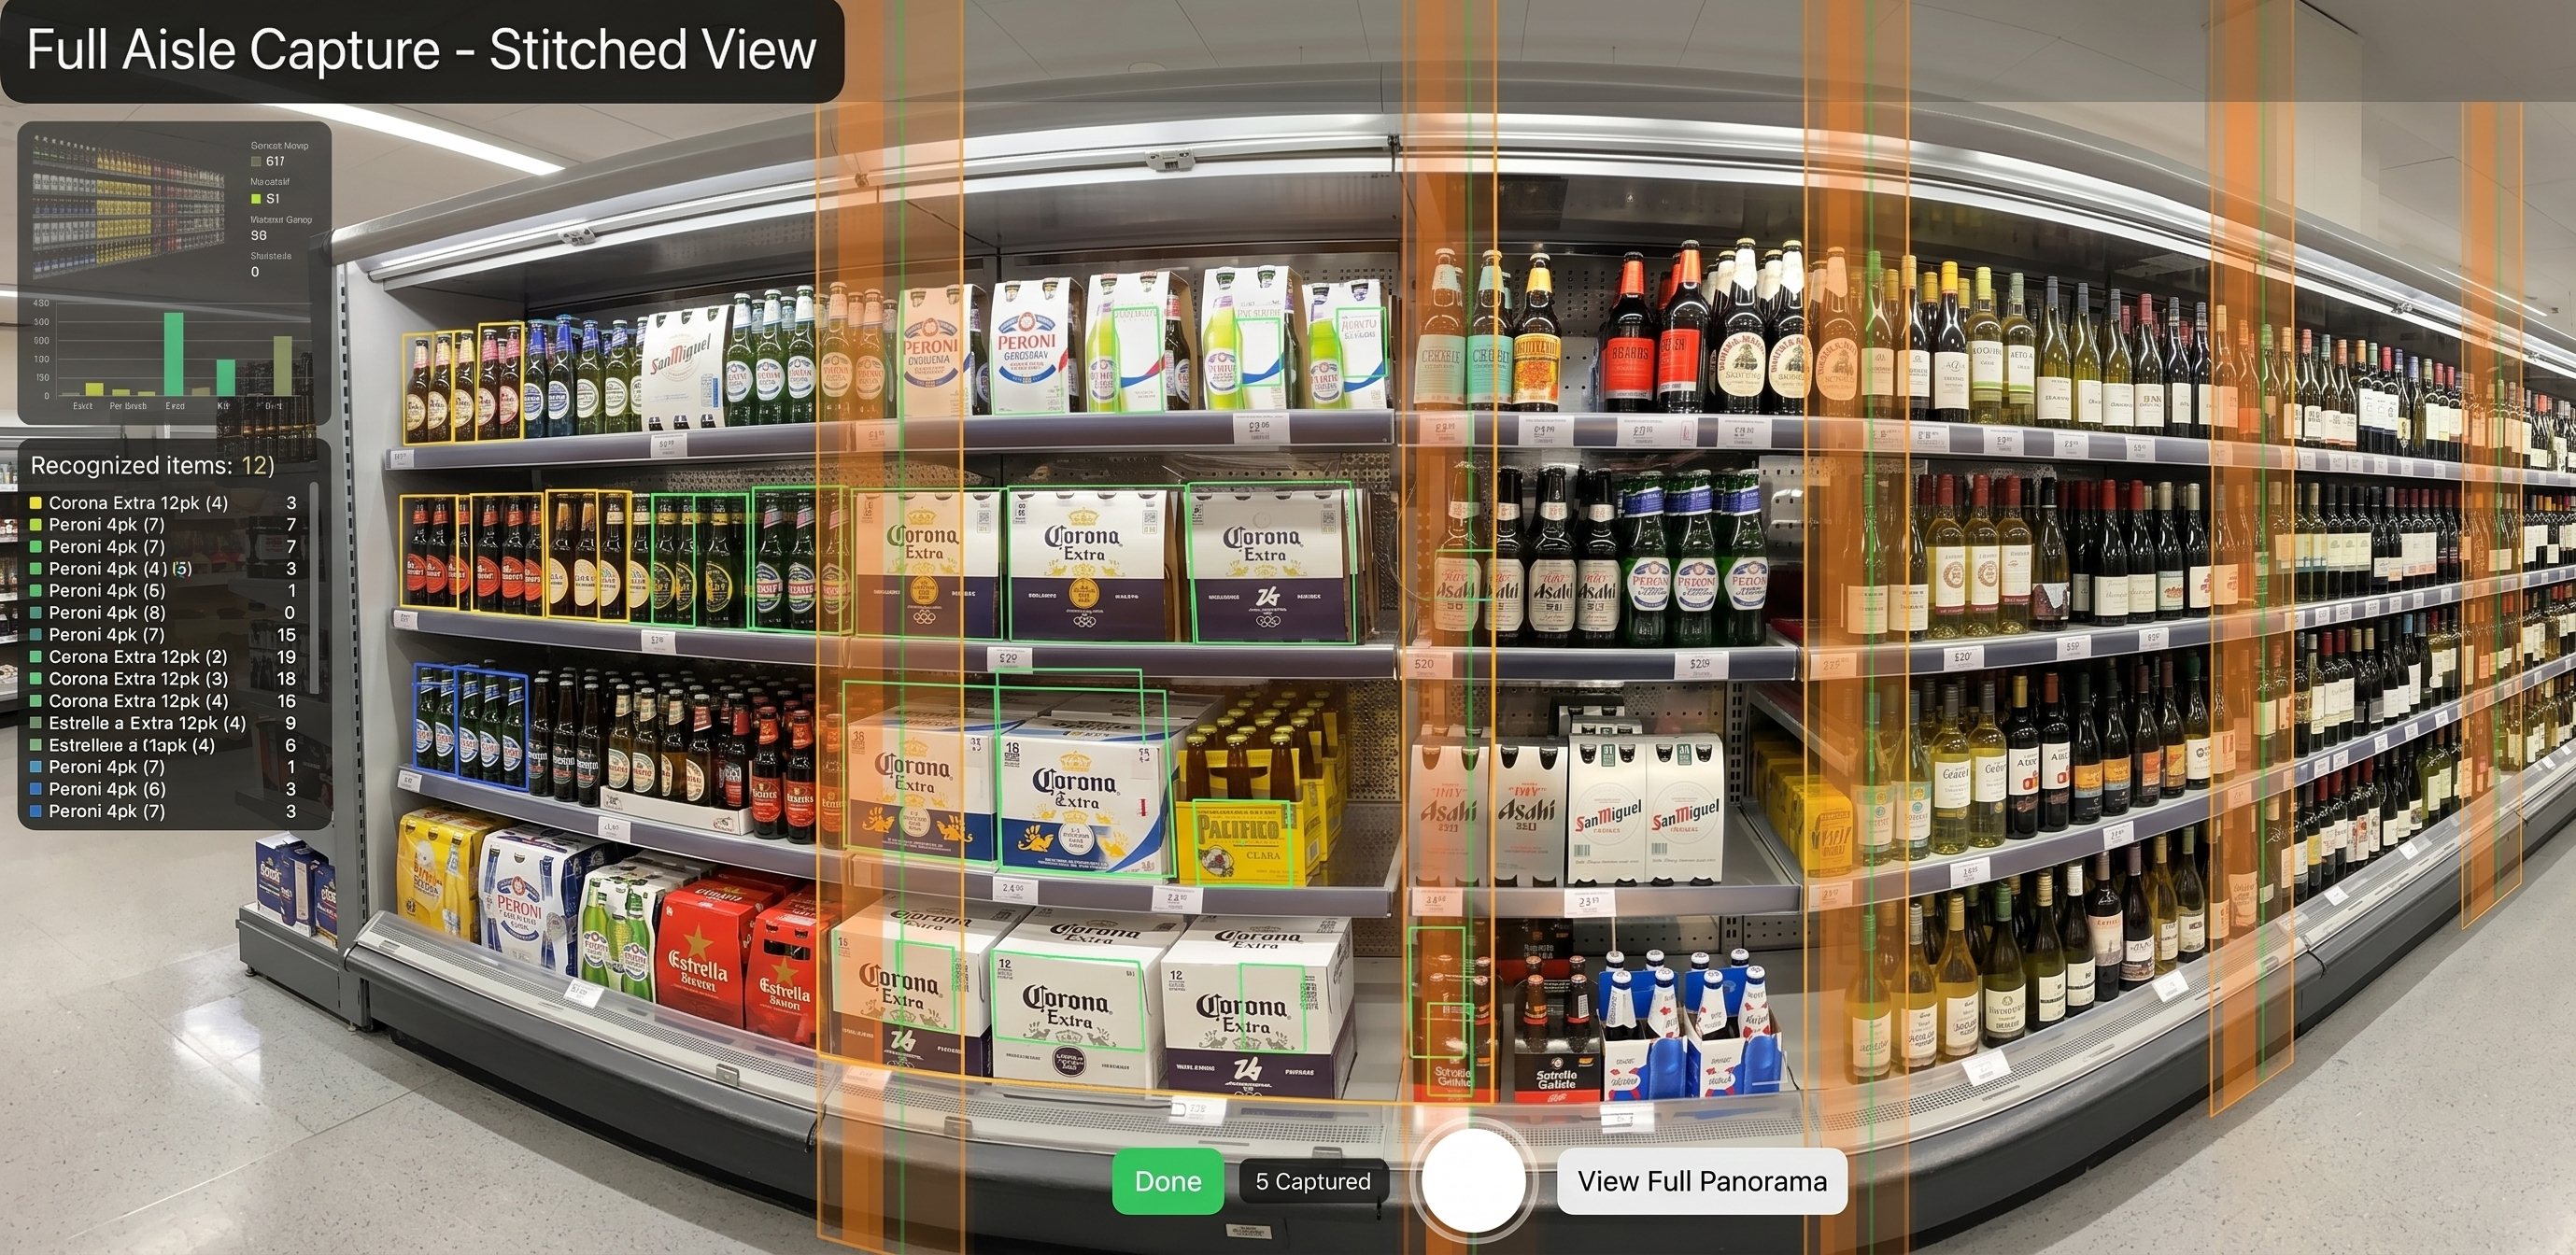
Full-aisle stitched capture recognising cases and packs across a chilled aisle
Stage 01 · CaptureA full aisle stitched into one view, recognised item by item, as a by-product of an ordinary store walk.

The four execution levers.

Execution Intelligence is delivered through four interconnected strategic levers. Together they form a complete, connected system.

Most competitors answer: how do I capture shelf data?
We answer: did my execution actually drive revenue? That difference in framing is the category-defining competitive advantage.
01
Lever 01

Smarter Auditing

From compliance checkbox to performance intelligence.

02
Lever 02

Field Force Optimisation

From data collector to commercial actor.

03
Lever 03

Inventory Optimisation

Closing the loop between shelf and supply chain.

04
Lever 04

Commercial Strategy

Turning execution data into a decision engine.

Chapter 03 Lever 01 of 04
Lever 01 · Smarter Auditing

Smarter Auditing.

From compliance checkbox to performance intelligence. Retail auditing has not changed its fundamental model in decades. It is time it did.

01
Why now

From 45 minutes to under 20, every minute spent better.

Retail auditing is one of the oldest disciplines in CPG commercial operations. The question is not whether to audit, it is whether the auditing being done is generating intelligence that drives commercial outcomes, or simply confirming compliance after the fact.

Most retail auditing today falls into the latter category. It is manual, infrequent, expensive to scale and structurally delayed. By the time a scheduled audit captures a planogram deviation or a missing display, the execution window may have already closed.

Smarter Auditing transforms it. A single photograph of a store fixture generates a complete execution read in minutes. But the bigger shift is what happens next: reps are guided by next best actions, ranked by commercial impact, so the time saved on data collection is reinvested into the conversations and interventions that move volume.

50%
Reduction in audit time
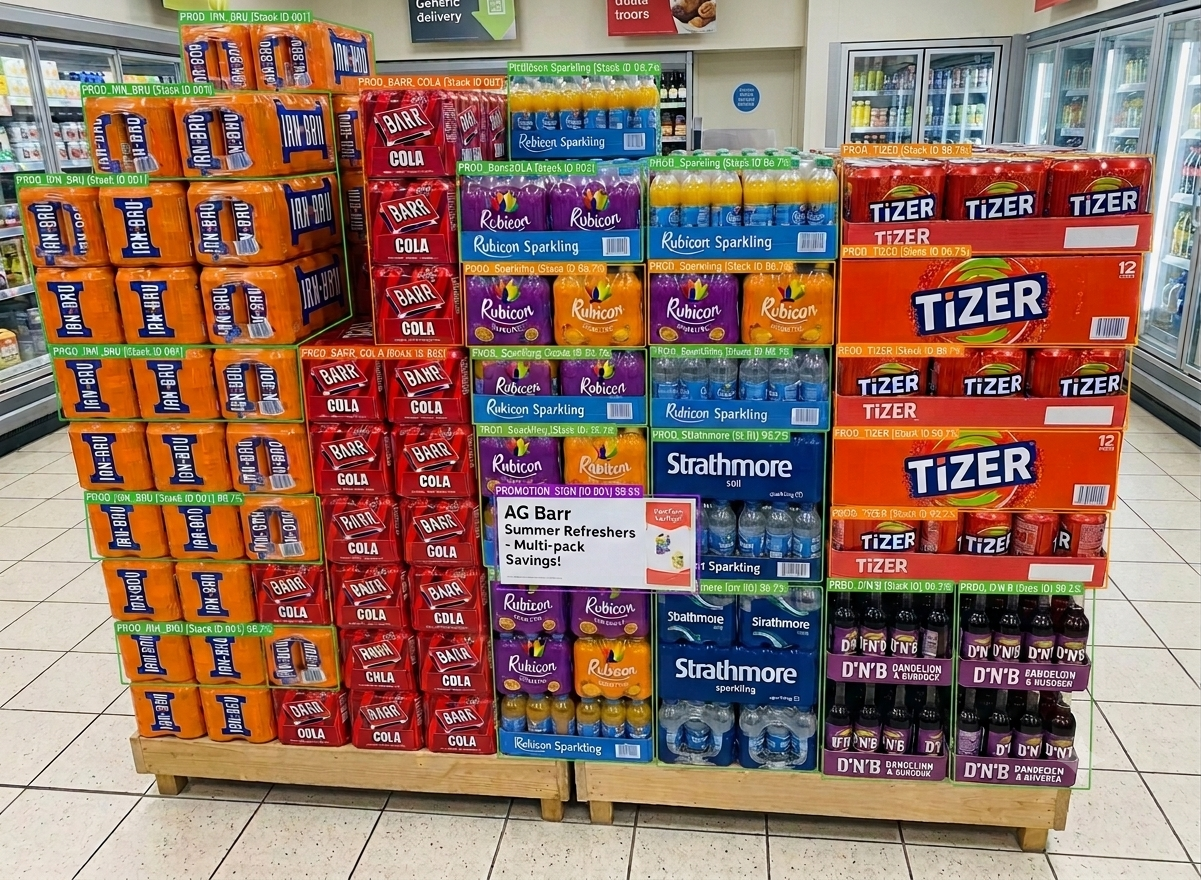
AG Barr achieved a 50% reduction in store audit time after implementing Neurolabs, hours now invested in commercial selling activity.
+95%
Product recognition accuracy
Across diverse store environments, varying lighting and complex shelf configurations. New SKUs onboarded in under one minute.
<1min
SKU onboarding
Synthetic data eliminates the bottleneck of training new products before they can be tracked at scale.
A real Diet Coke can beside a photorealistic digital twin of the same can
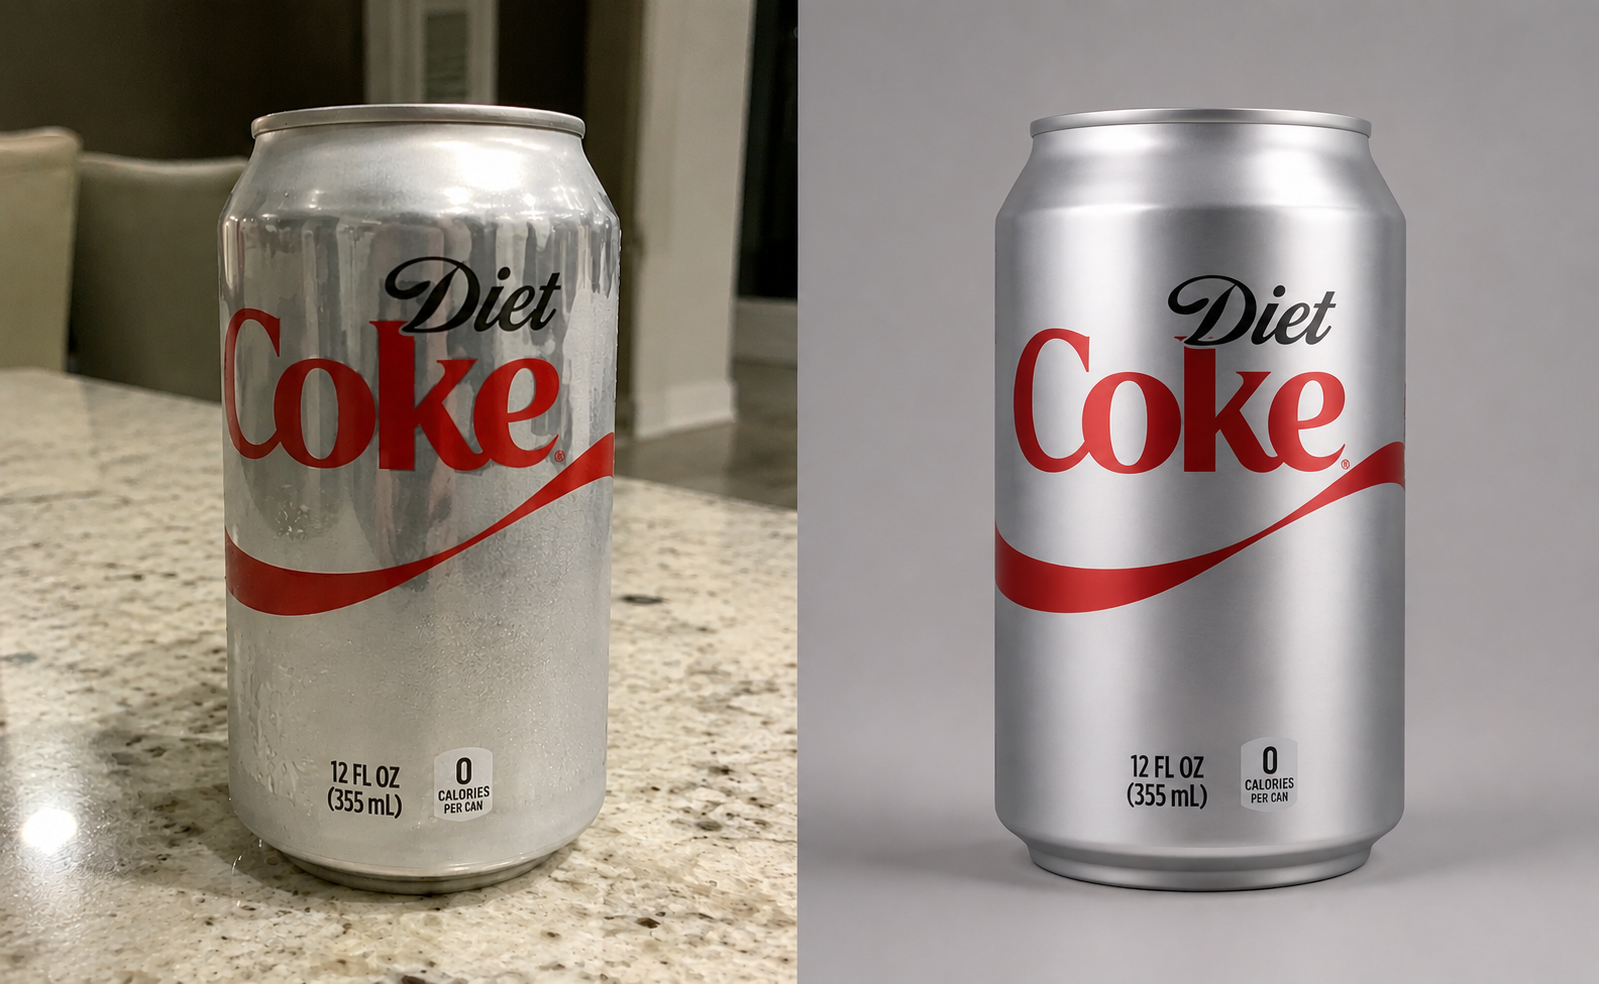
OnboardingA real product (left) and its digital twin (right). New SKUs become recognisable without a studio shoot, so tracking starts the day a product exists.

A single photograph of a fixture delivers:

  • Which SKUs are present, correctly positioned and facing the shopper.
  • Whether the promotional mechanic is displayed correctly and at the right price.
  • How share-of-shelf compares to the brand's plan and to competitors.
  • Whether the planogram specification has been followed.
  • What competitor activity is visible and how it compares to your own execution.
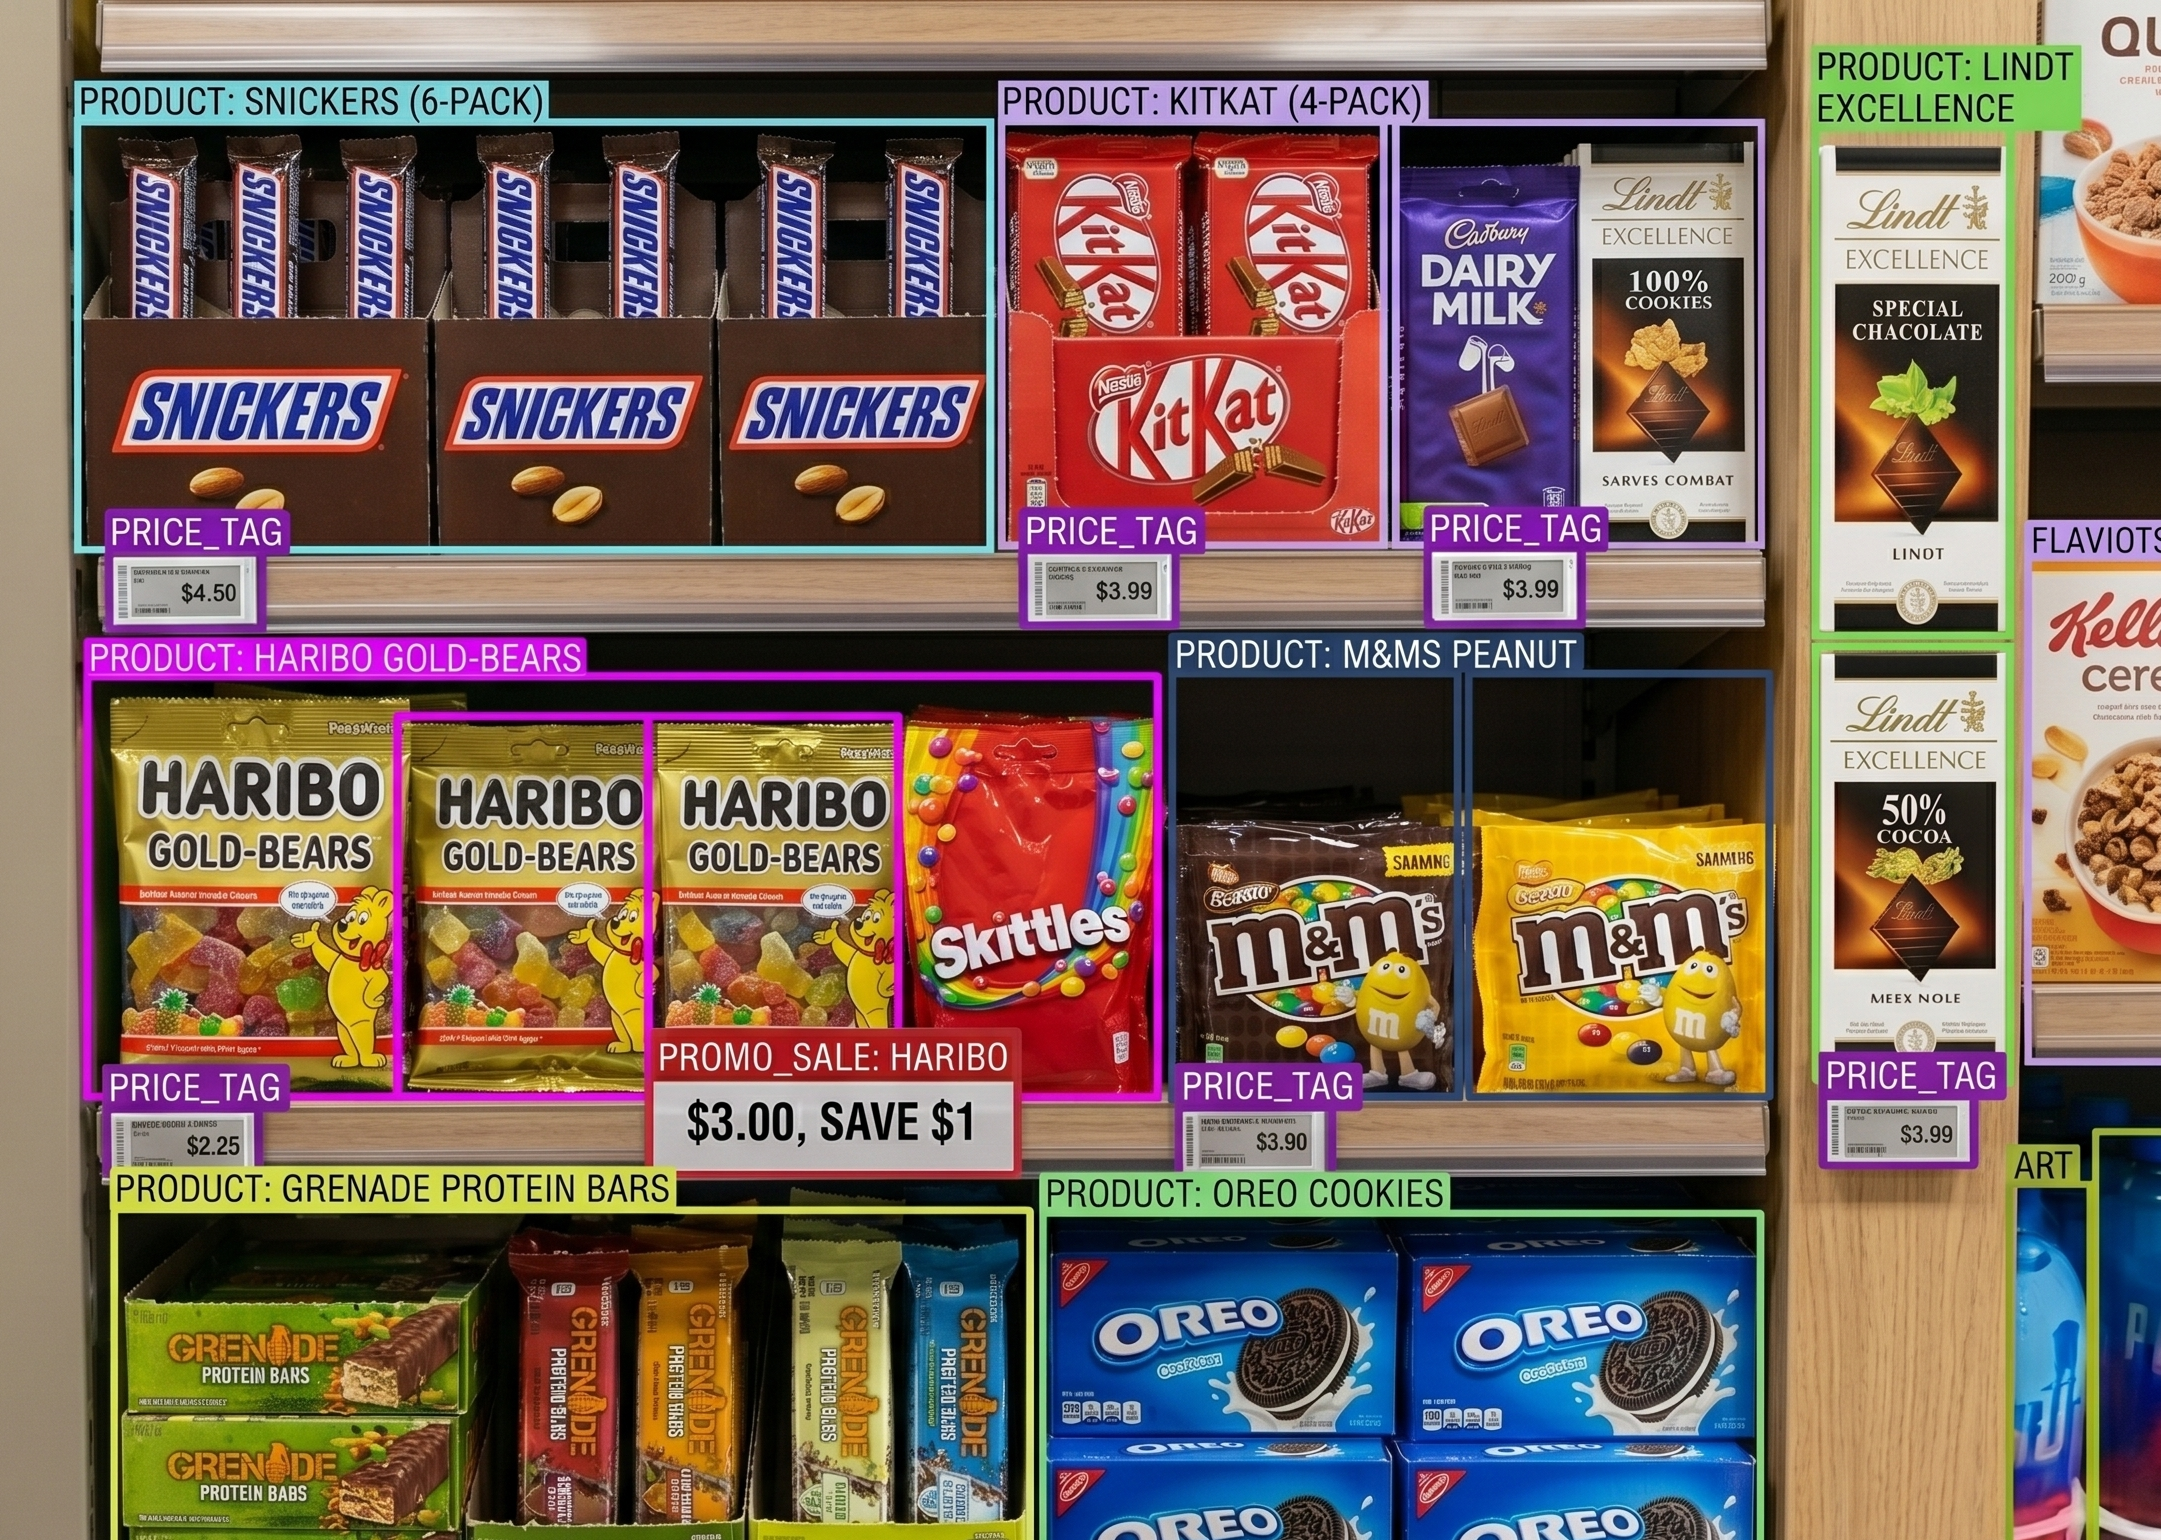
Confectionery fixture with products, price tags and promotions detected
One photo, readProducts, price tags and live promotions detected together, with the promotional mechanic and shelf price read straight off the fixture.
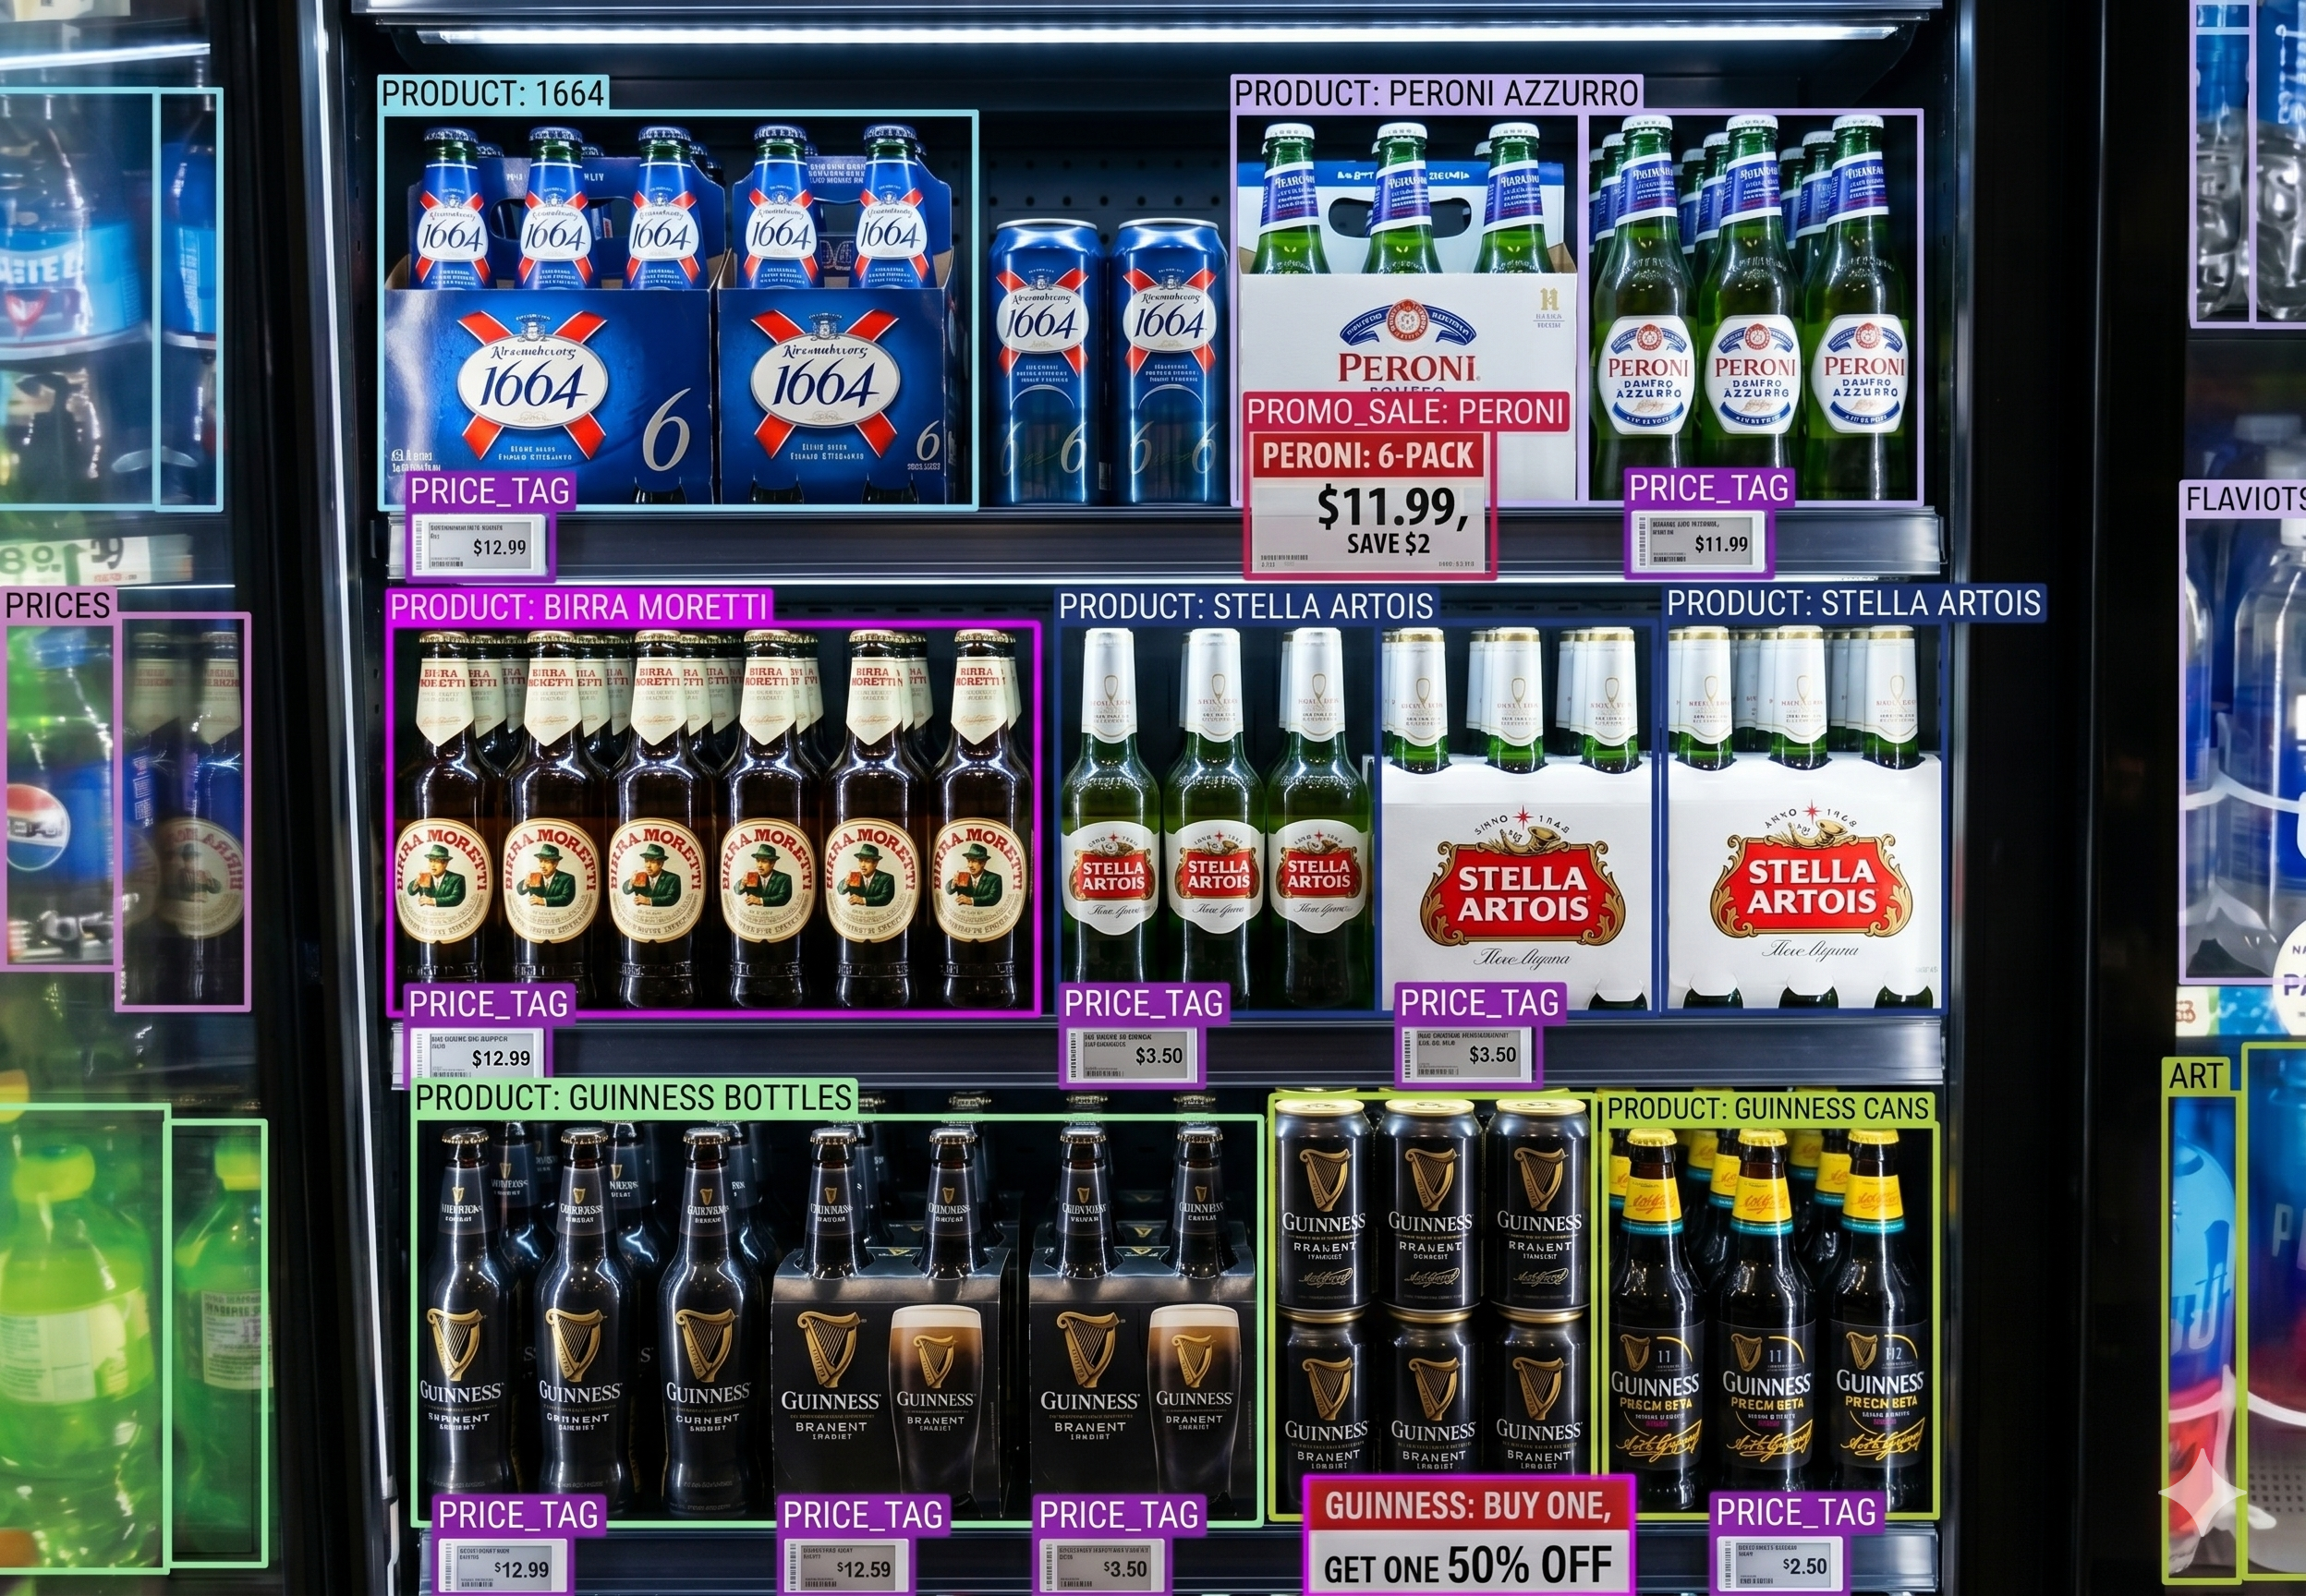
Beer chiller with products, price tags and a promotion detected
Promo complianceBeer & Spirits chiller, promotion verified.
Cold vault door with individual SKUs and prices detected
SKU recognitionCold vault, every facing identified.
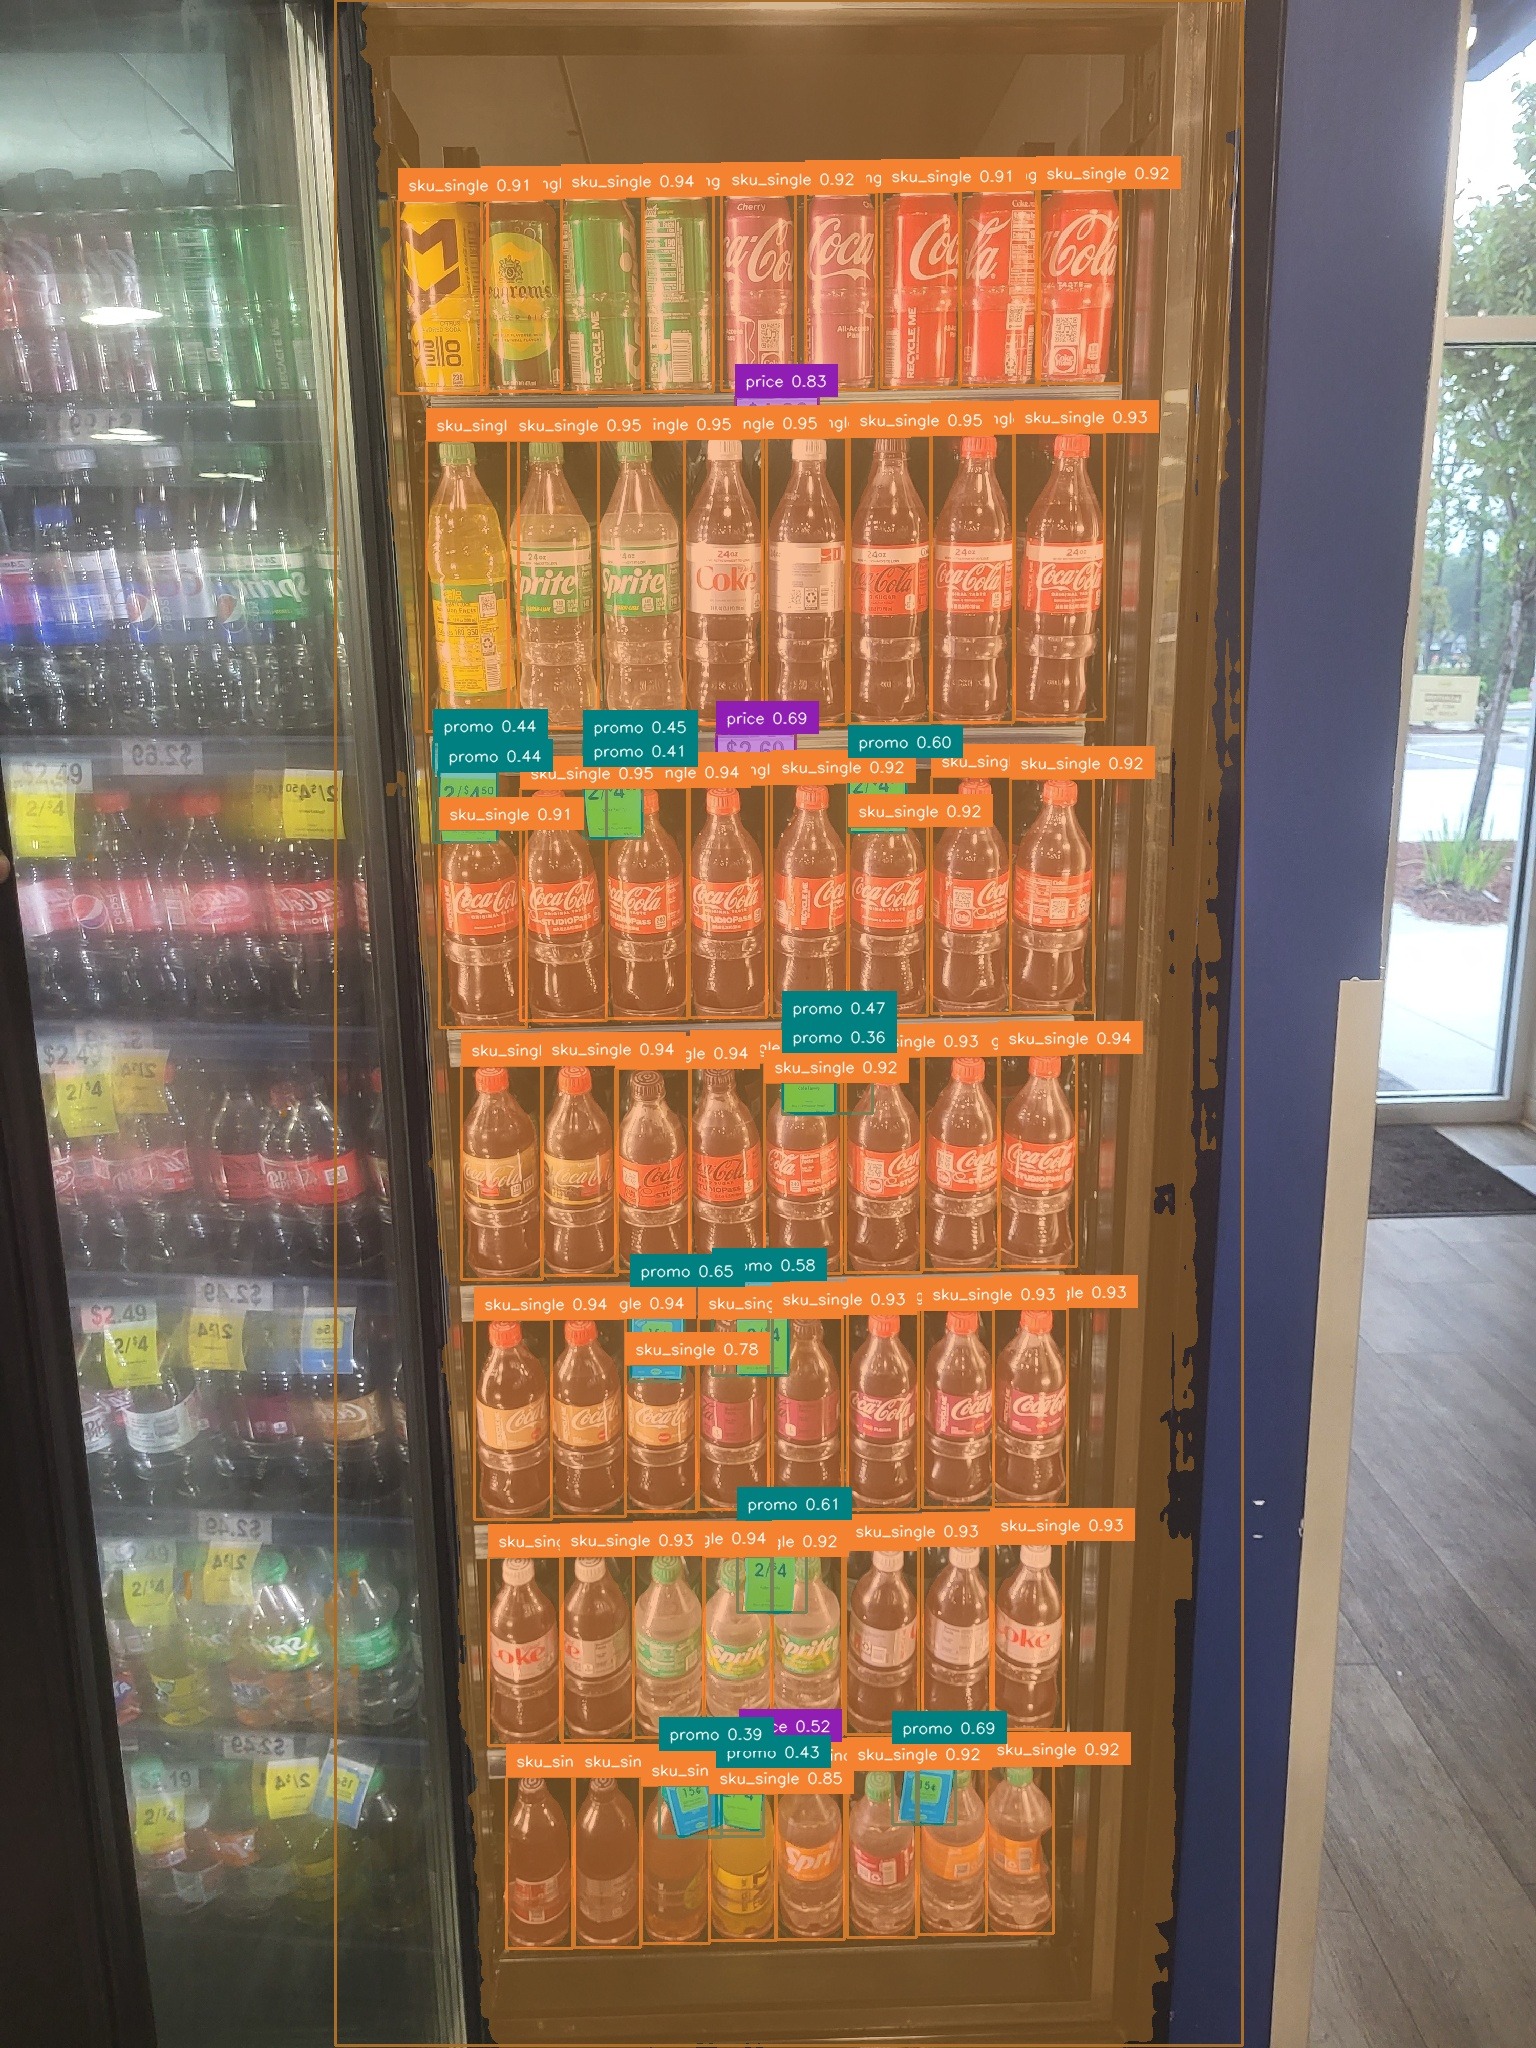
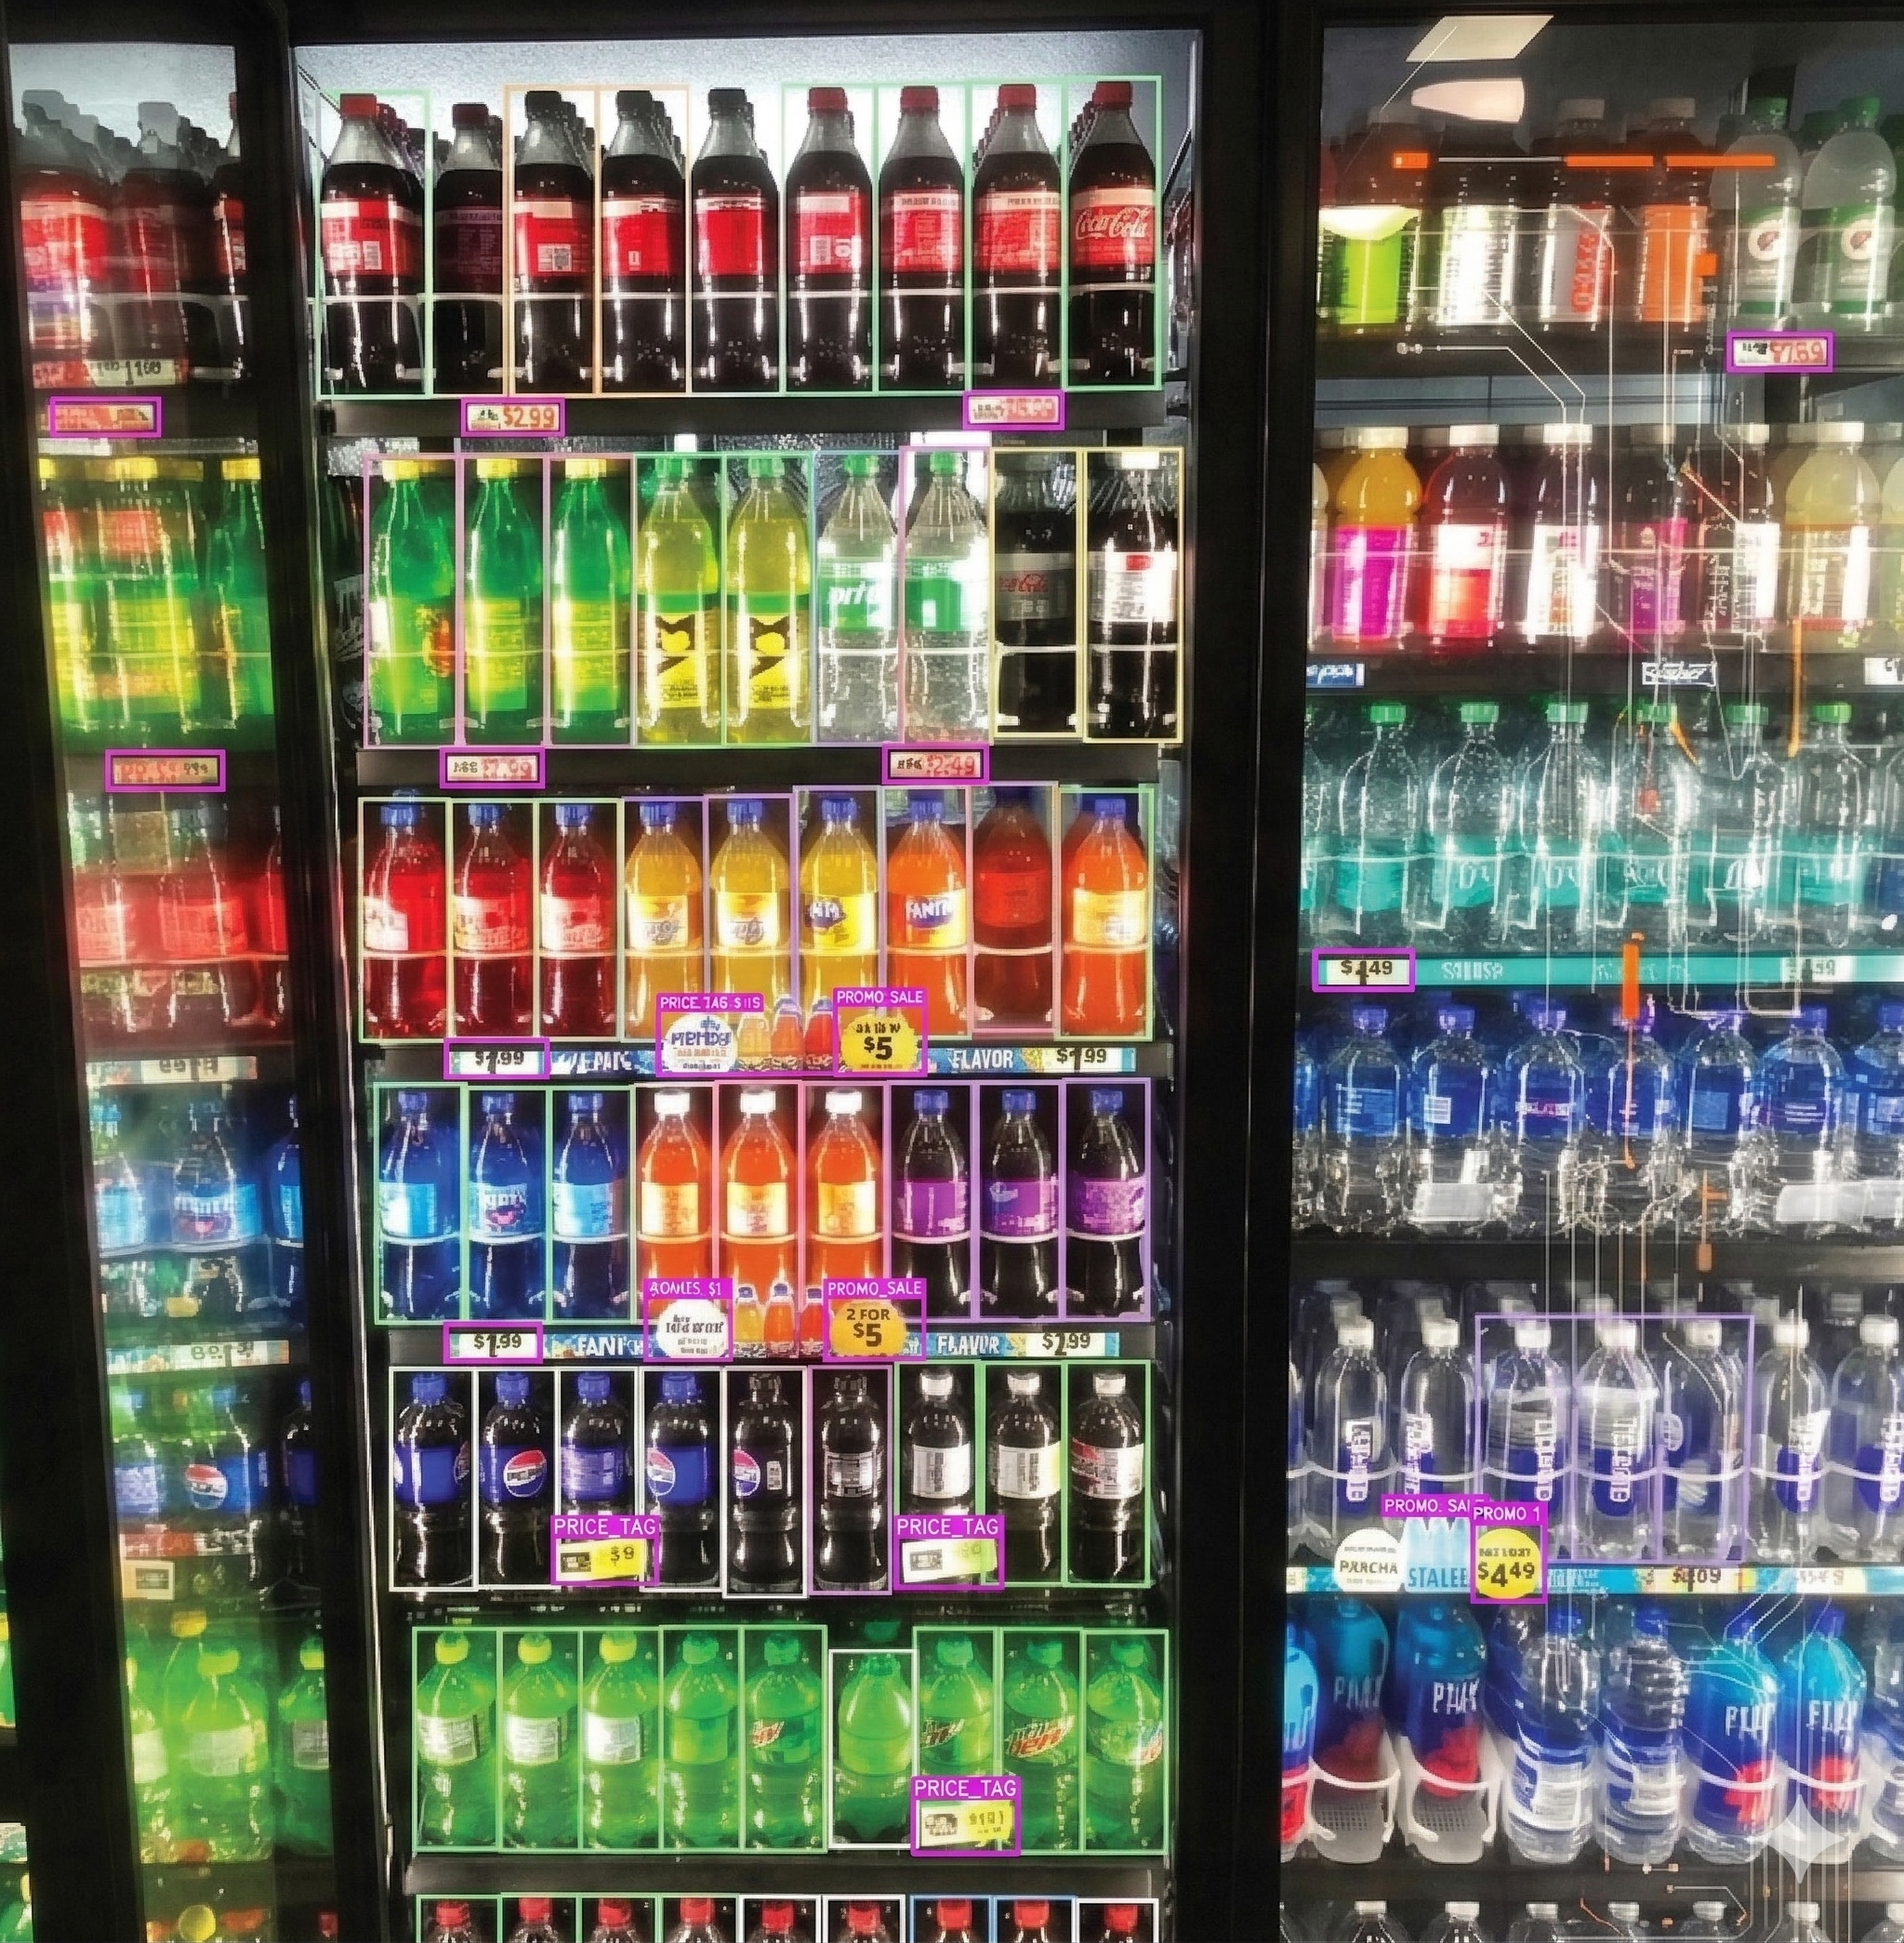
Soft drinks chiller with price tags and promotions detected
Pricing accuracySoft drinks, shelf prices and promos checked.

What Smarter Auditing makes possible.

From planogram compliance to competitive intelligence, captured continuously, at scale, as a by-product of the brand's own execution monitoring.

Planogram compliance at scale

Verify adherence across the full estate, not just scheduled visits. Deviation surfaces automatically while the execution window is still open.

Promotional compliance tracking

Monitor every promotional window in near real time. Identify and address non-compliance during the campaign, not after.

Pricing accuracy verification

Shelf edge prices verified against planned architecture, including promotional prices. Price leakage caught early, not in a debrief.

Share-of-shelf visibility

The brand's actual share of shelf space measured objectively. Encroachment and secondary placement performance visible in near real time.

Competitor tracking

Competitor activity captured as a by-product of your own monitoring. A continuous competitive intelligence feed, no extra field effort.

Audit → Commercial intelligence

The raw data becomes commercial intelligence when it is structured, contextualised and connected to the questions that drive decisions.

Chapter 04 Lever 02 of 04
Lever 02 · Field Force Optimisation

Field Force Optimisation.

Your best commercial asset is the field rep standing in front of a shelf. Not the one filling in a form.

02
The field force paradox

Hundreds of millions invested in people. Hours per day spent on forms.

For major brands, the field sales force means hundreds or thousands of representatives visiting stores every day, building relationships, maintaining compliance and driving commercial outcomes.

Yet for most of those representatives, a significant portion of every visit is consumed not by selling activity, but by data collection. Photographing shelves. Filling in audit forms. Manually recording compliance information that will be reviewed, if at all, days later, by someone who cannot do anything actionable with it.

Field Force Optimisation reframes the role of the field representative, from data collector to commercial actor and equips them with the real-time insights needed to make every store visit commercially productive.

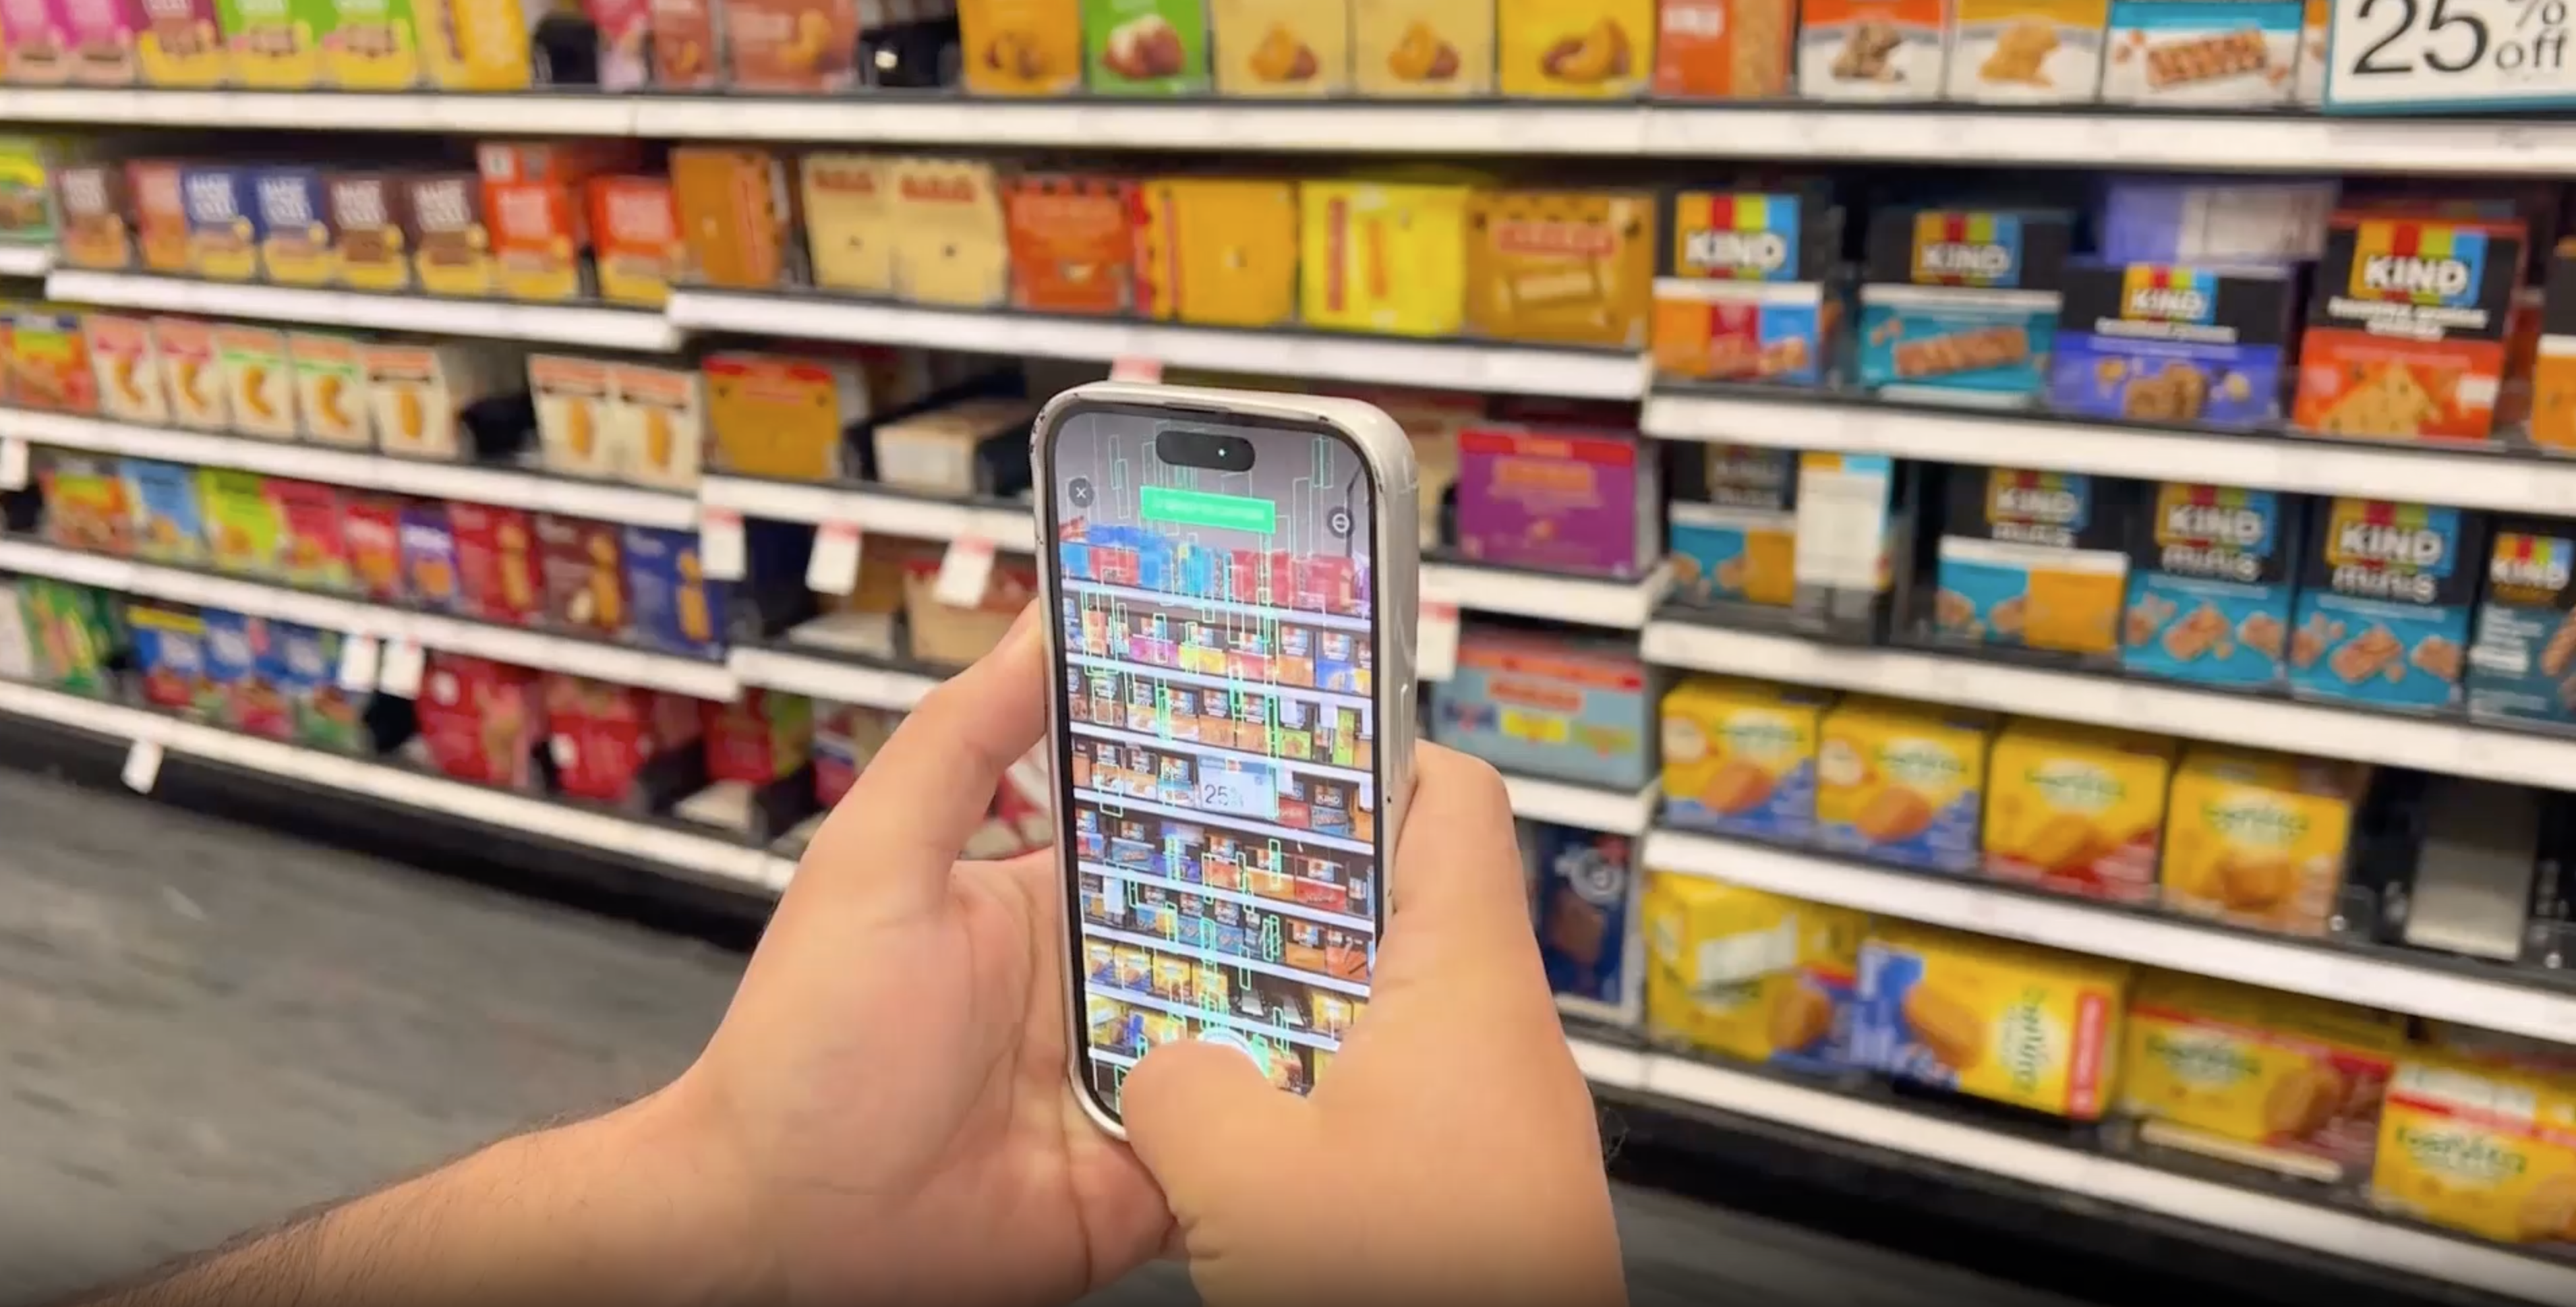
A rep pointing a phone at a shelf, live recognition overlaid on screen
On deviceThe analysis happens in the rep's hand. A single capture returns a complete fixture read, in the aisle, in minutes.

What the rep's day looks like.

Same person. Same eight hours. Two fundamentally different operating models.

Before · Manual model
  • 01Arrives at store with no prior visibility of current shelf conditions.
  • 02Spends 45+ minutes on manual shelf walk and form completion.
  • 03Records compliance data on SFA or paper.
  • 04Data submitted, aggregated by manager days later.
  • 05Leaves store without knowing which issues were highest priority.
  • 06Next visit: same cycle, same delay.
After · Execution Intelligence
  • 01Receives real-time execution brief before arriving, current shelf conditions already known.
  • 02Priority action list on device: ranked by revenue impact.
  • 03Single photo captures complete fixture analysis in minutes.
  • 04Issues resolved on the spot, resolution confirmed immediately.
  • 05Commercial selling time significantly increased.
  • 06Next visit pre-informed by today's data, continuous improvement loop.
We do not add steps to your field team's workflow. We make the ones they already have work better and point them at the conversations that move volume.
Next best action

Turning data into guided decisions.

Rather than arriving at a store and deciding what to prioritise, the rep receives a structured action list based on:

  • Current execution compliance gaps, ranked by revenue impact.
  • Historical performance of specific stores and accounts.
  • Promotional windows currently open or about to close.
  • Competitor activity that requires a commercial response.

The store visit becomes a structured commercial intervention, with every action connected back to a measurable outcome.

Chapter 05 Lever 03 of 04
Lever 03 · Inventory Optimisation

Inventory Optimisation.

Your supply chain system knows what sold. It does not know what was missing from the shelf.

03
Why OOS stays stubborn

Supply chains are fed by POS data, not shelf data.

7-figure Commercial gain opportunity per major brand from a 1–2 pp reduction in OOS.

Out-of-stocks are one of the most studied problems in retail and one of the most consistently unsolved. Despite decades of investment in supply chain technology, inventory management systems and replenishment automation, the global average out-of-stock rate in CPG remains stubbornly high.

The reason is structural. Most systems know when product has sold through. They do not know when product has disappeared from the shelf without selling, because it was hidden behind a facing, misplaced in the back room, or simply never put out.

Phantom inventory, product recorded as available but not on the shelf, is one of the most persistent causes of lost sales in retail. The system sees no reason to trigger replenishment. The customer sees an empty shelf. A competitor brand gets the sale.

The cost of not knowing is always higher than the cost of knowing. A seven-figure OOS opportunity is waiting in the gap between your inventory system and your shelf reality.

How Execution Intelligence connects shelf to supply chain.

Beverage shelf with visible empty facings between stocked products
Gap on shelfProduct sold through, or never put out? The gap is visible here long before it surfaces in an exception report.

Out-of-stock detection

When a shelf image shows a gap where a SKU should be, an alert is generated immediately, not in the next morning's exception report. The team can act before the sales loss compounds.

Phantom inventory identification

When system records show product as on-hand but shelf images show an empty fixture, the discrepancy is flagged automatically. Supply chain teams investigate and respond in near real time.

Automated replenishment triggers

For organisations with integrated supply chain systems, shelf data triggers replenishment workflows directly, without requiring manual intervention at the store level.

Image-to-order workflows

Advanced deployments connect shelf image analysis directly to purchase order generation. When a threshold is breached, an order workflow is automatically initiated.

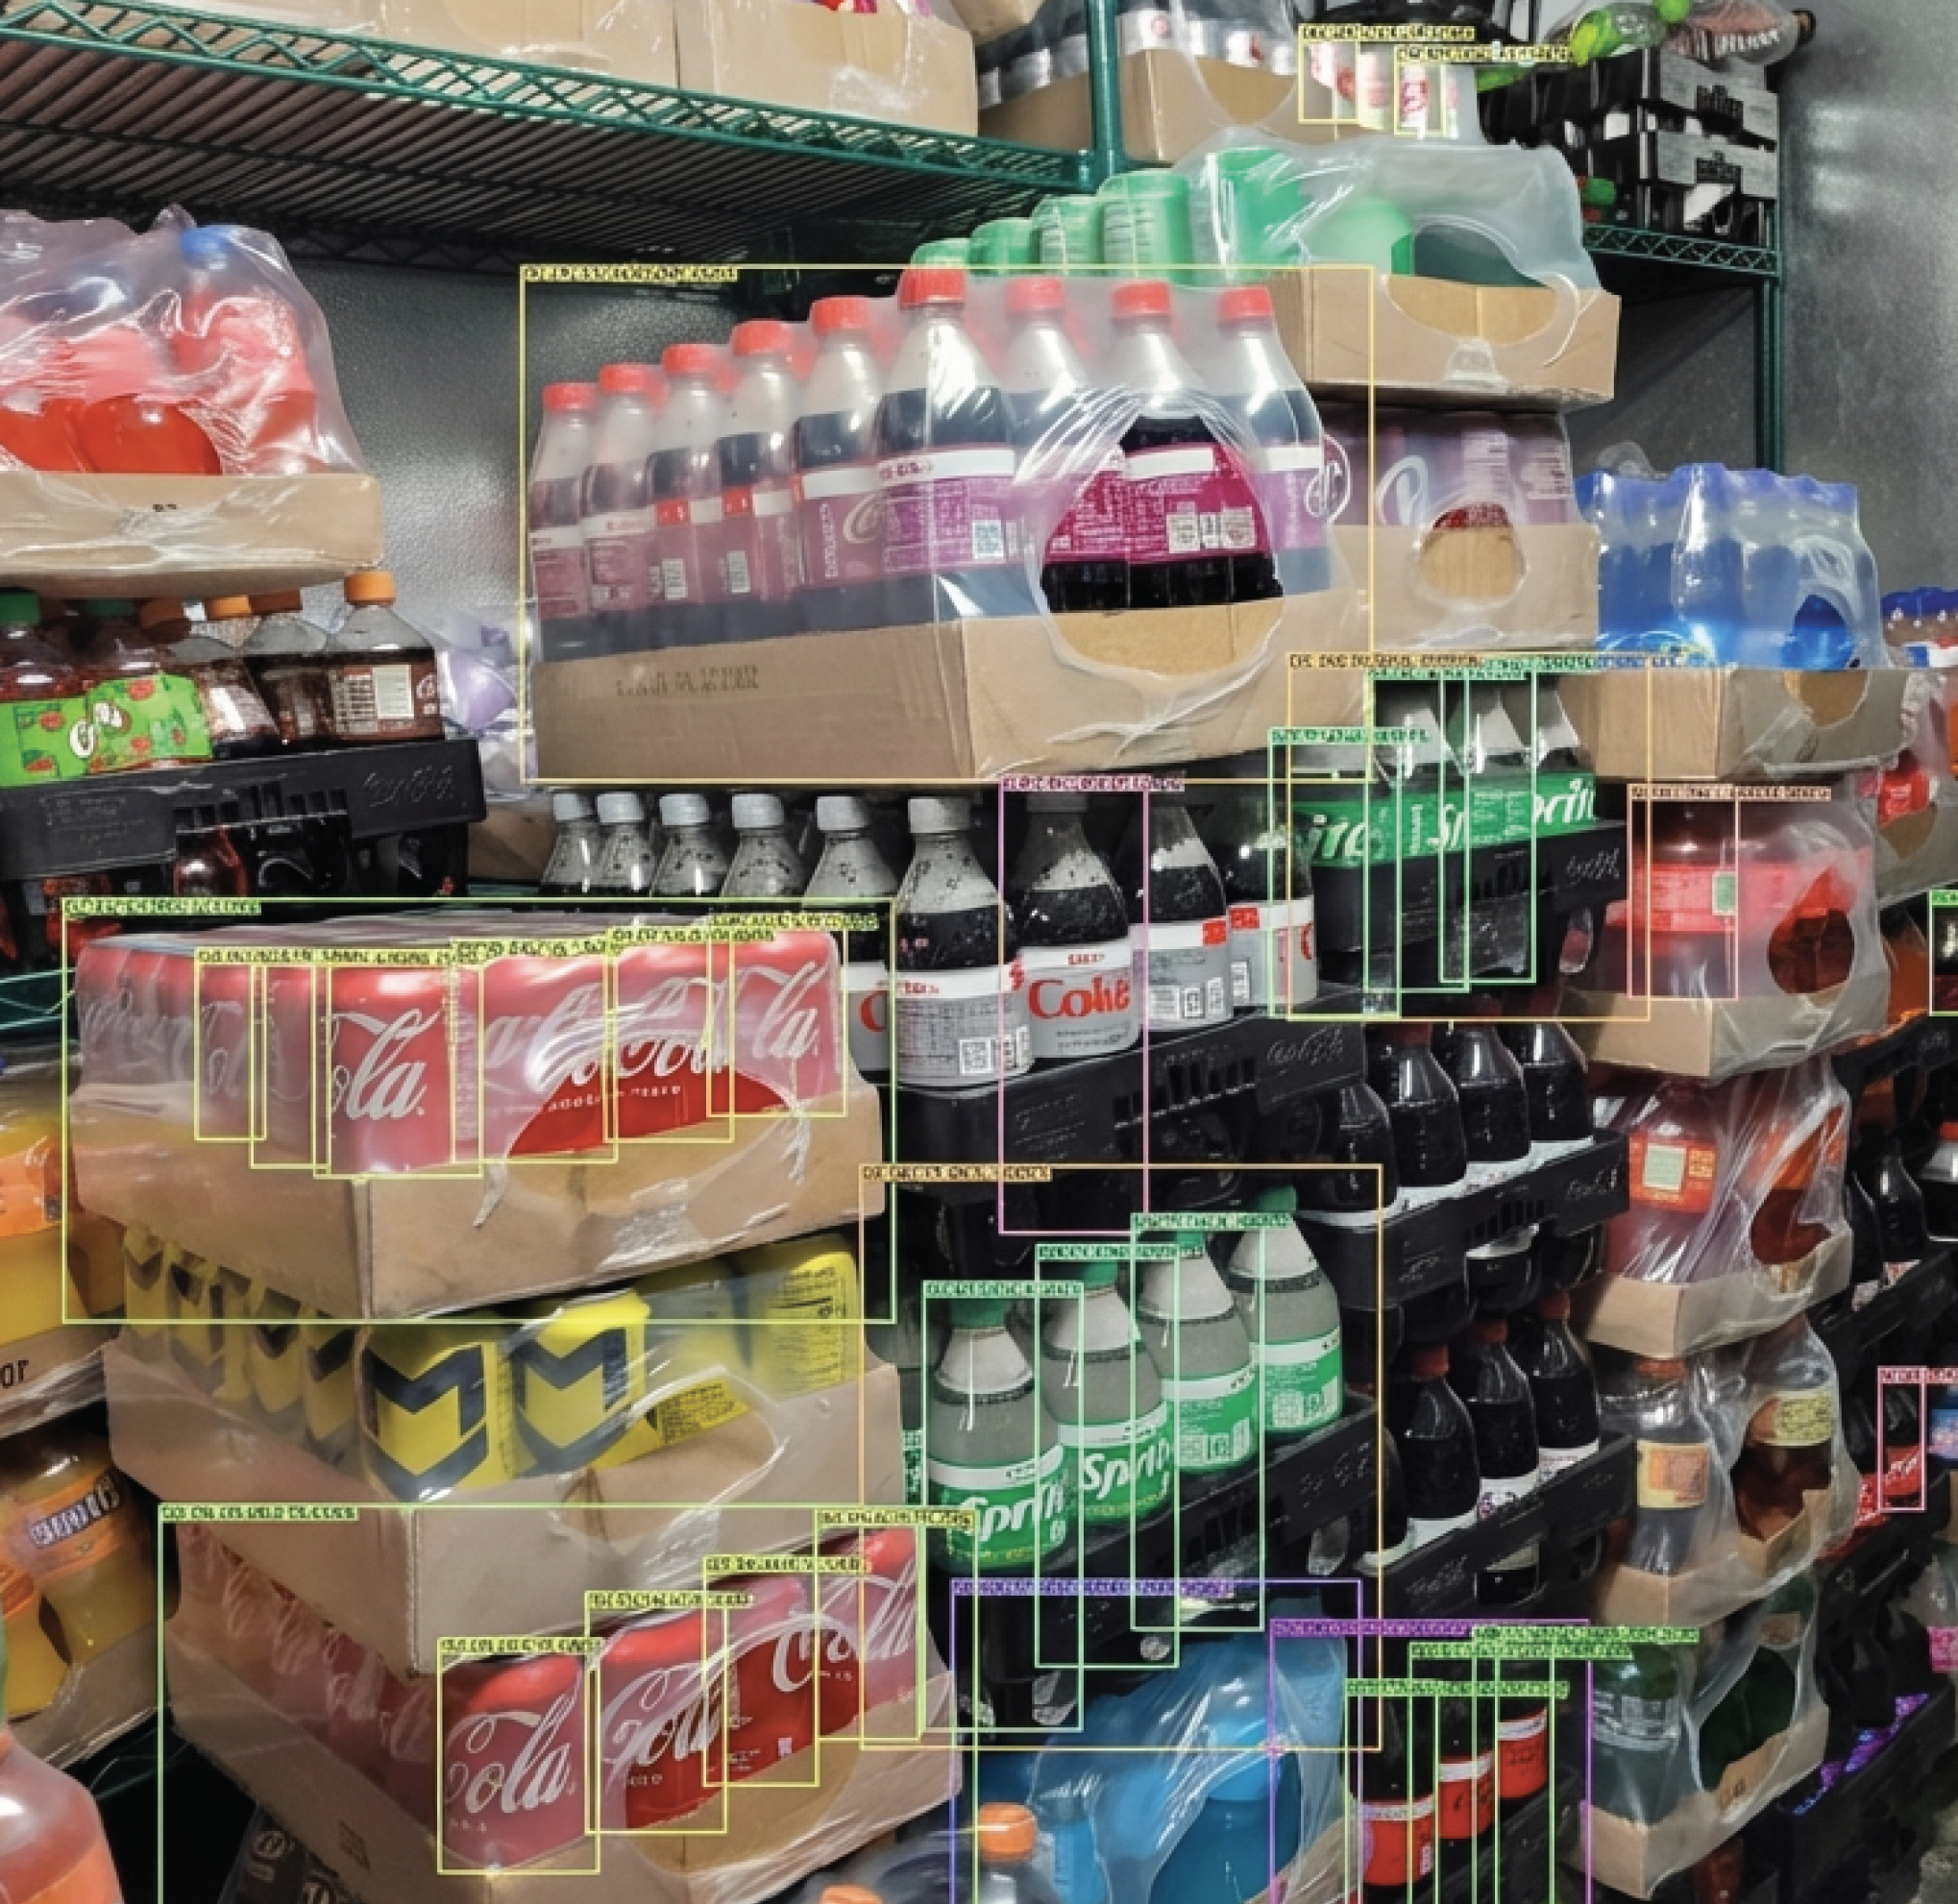
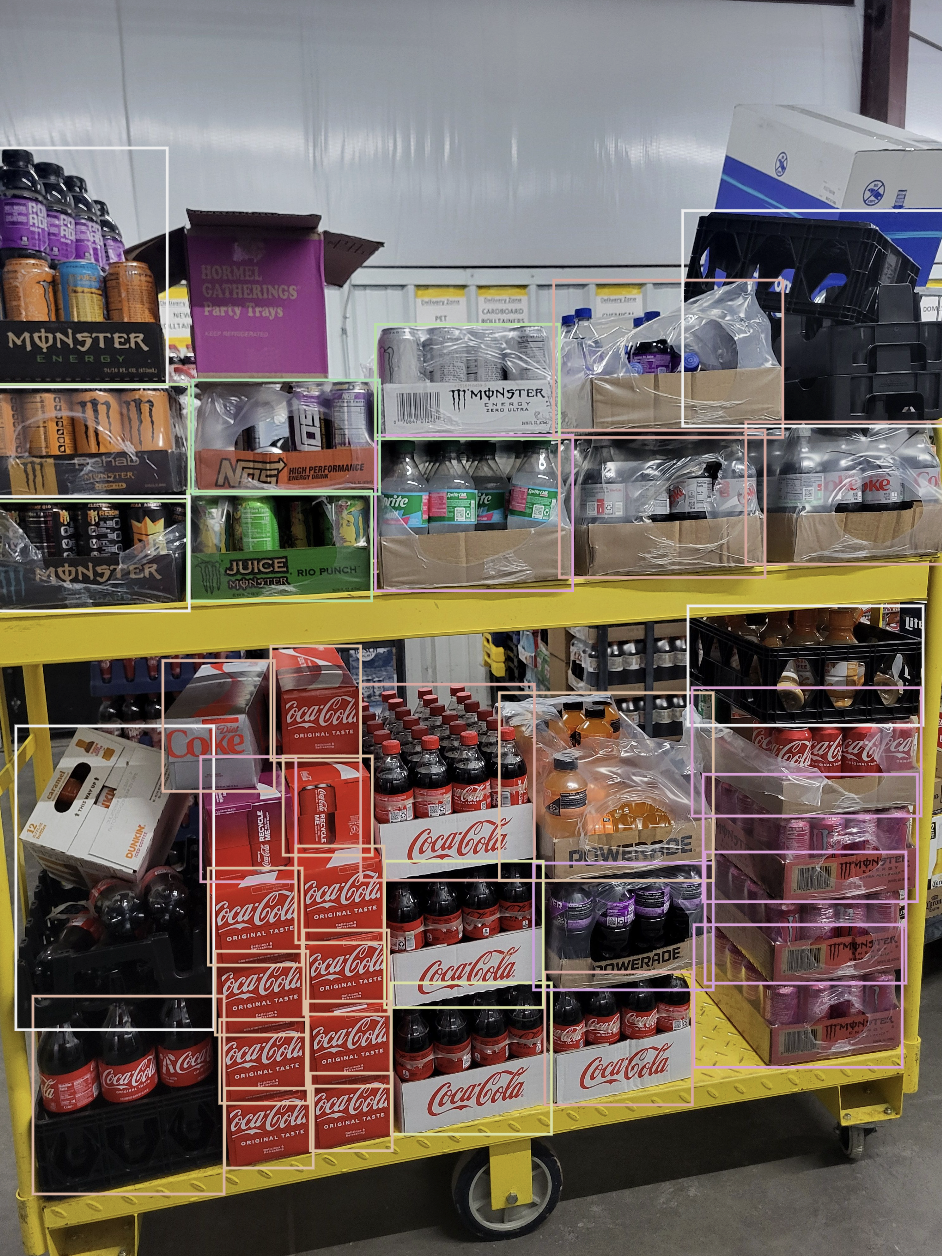
Backroom stock stacked on pallets with cases and packs detected
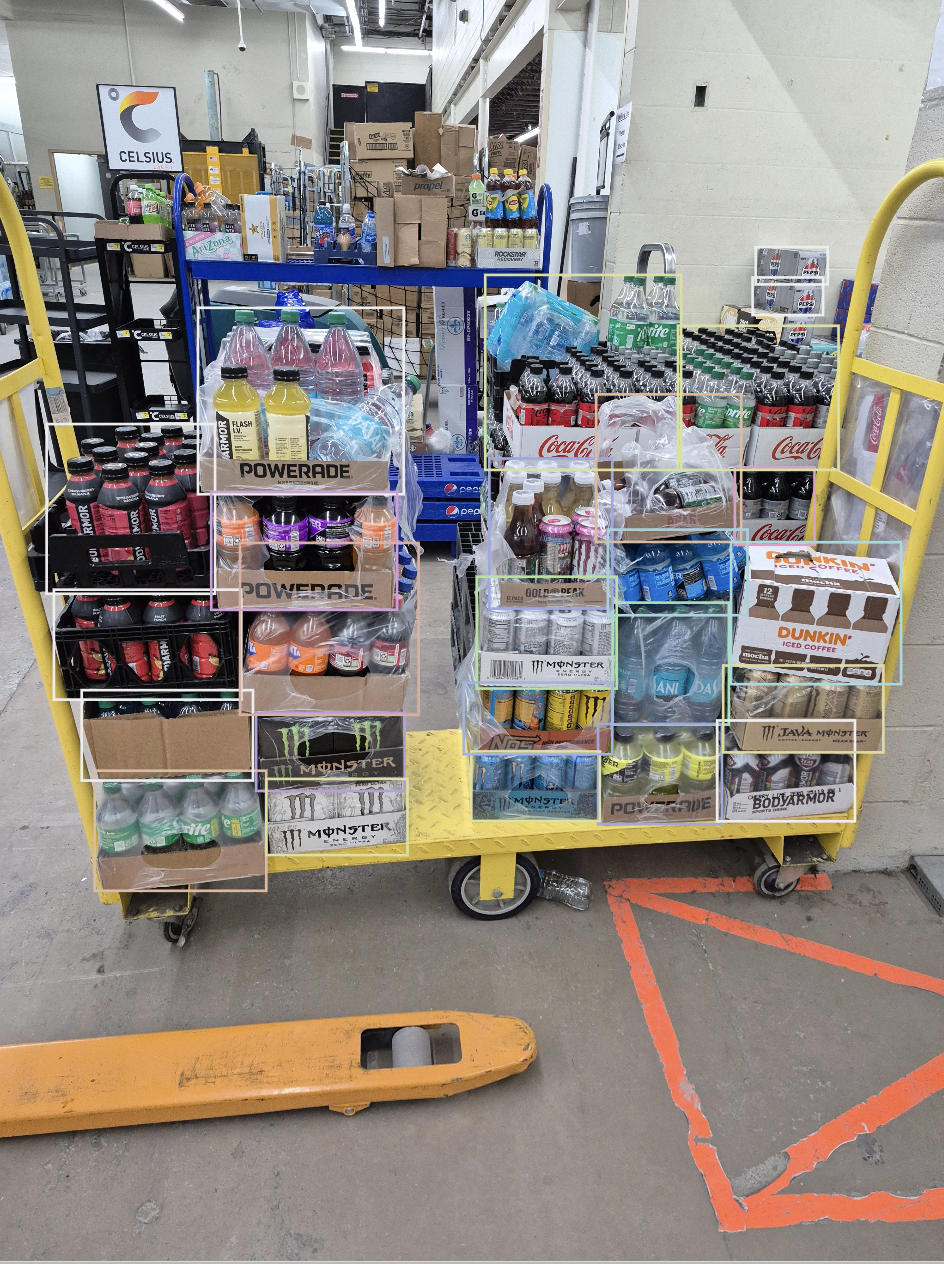
Delivery cart of mixed beverage cases with each pack detected
Stock cart of energy drinks and soft drinks with each case detected

BackroomVisibility does not stop at the shelf. Backroom and delivery stock is read too, so phantom inventory, product recorded on-hand but not on the floor, is surfaced instead of assumed.

Beyond direct volume impact, accurate shelf data lets commercial teams distinguish between demand shortfalls and execution failures in POS data. When an out-of-stock period is clearly identified it can be excluded from baseline demand, improving forecast accuracy and preventing a false read on volume trend.

Chapter 06 Lever 04 of 04
Lever 04 · Commercial Strategy

Commercial Strategy.

When execution data flows into commercial decision-making, the entire organisation gets smarter, fast.

04
A different lever

Not just fixing what went wrong, improving what gets planned next.

The first three levers close the execution gap. They ensure that what is planned happens in-store and that when it does not, commercial teams know about it in time to act.

The fourth lever is different in kind. Commercial Strategy is about taking all of that execution data and using it to make better decisions upstream, using evidence of what happened in-store to improve the strategies being set at headquarters.

This is where Execution Intelligence becomes a competitive advantage that compounds. The brands that build execution data infrastructure today will have richer, more accurate commercial intelligence to work with tomorrow, in every planning cycle, every promotion, every product launch.

You cannot validate trade ROI without knowing whether the trade activity actually executed. Execution data is not an operational nice-to-have, it is a prerequisite for commercial accountability.

Closing the loop on trade investment.

CPG companies collectively invest hundreds of billions per year in trade promotions. Execution data changes what you can do with that investment.

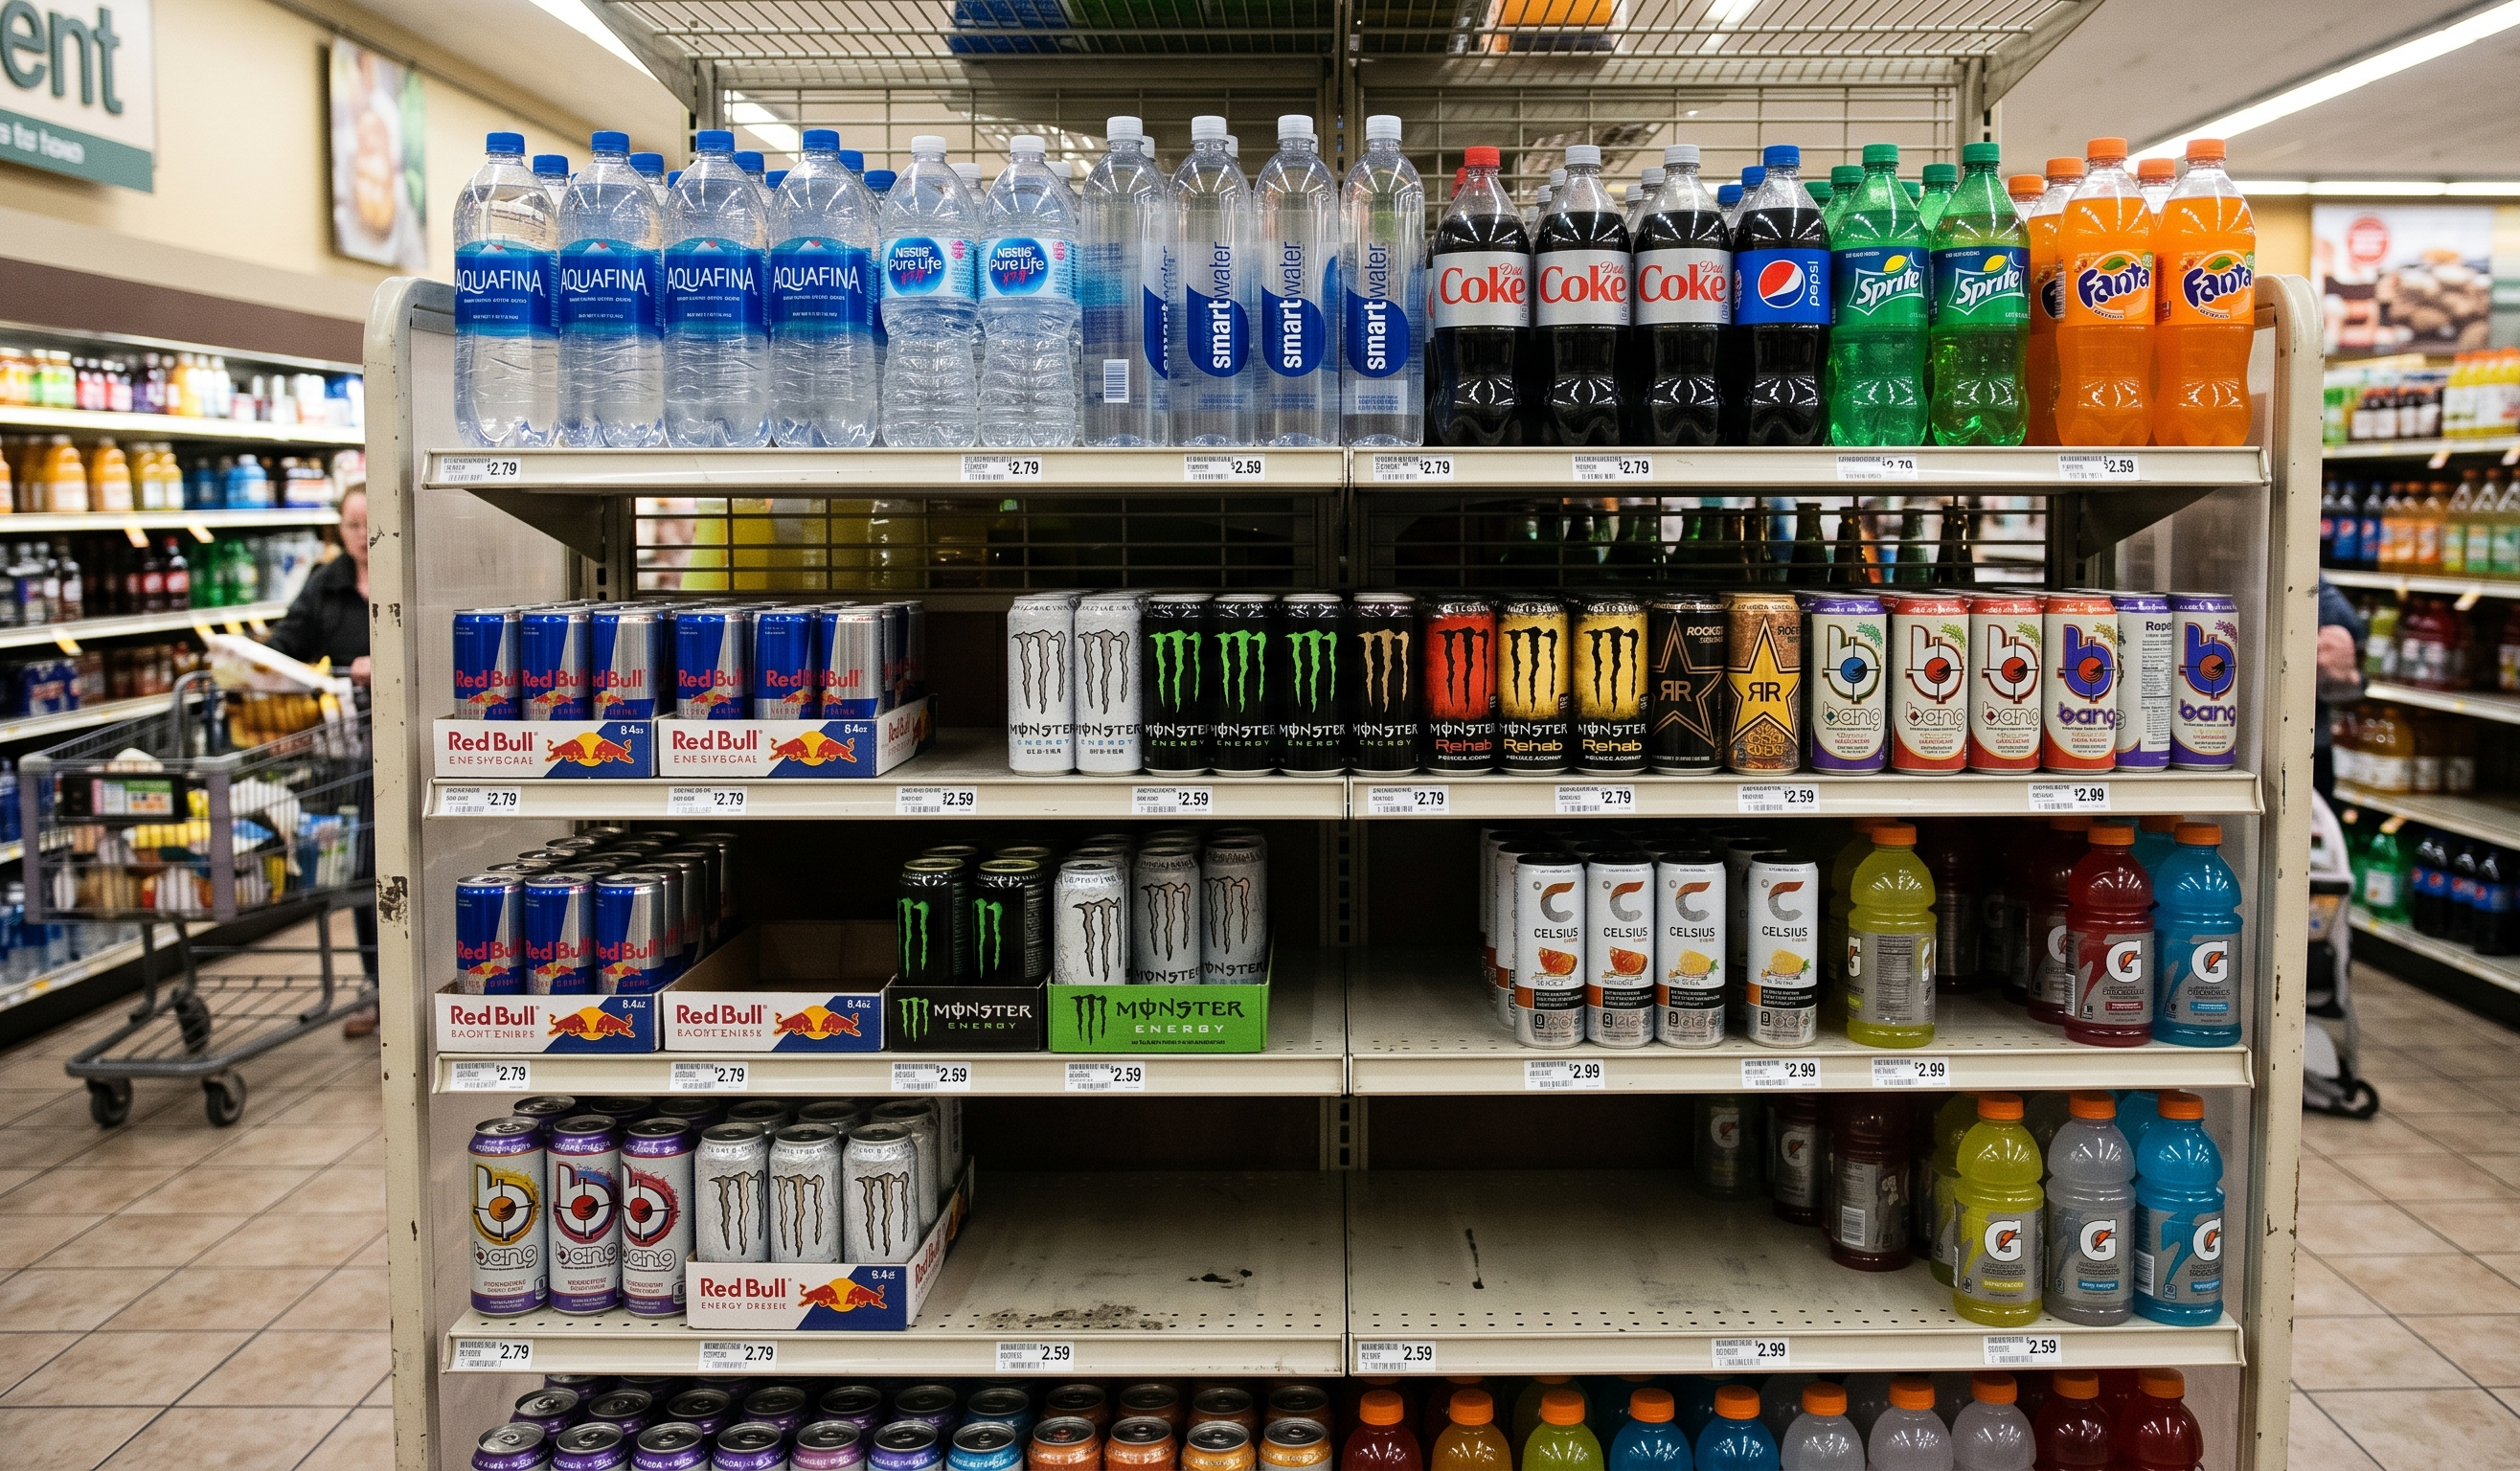
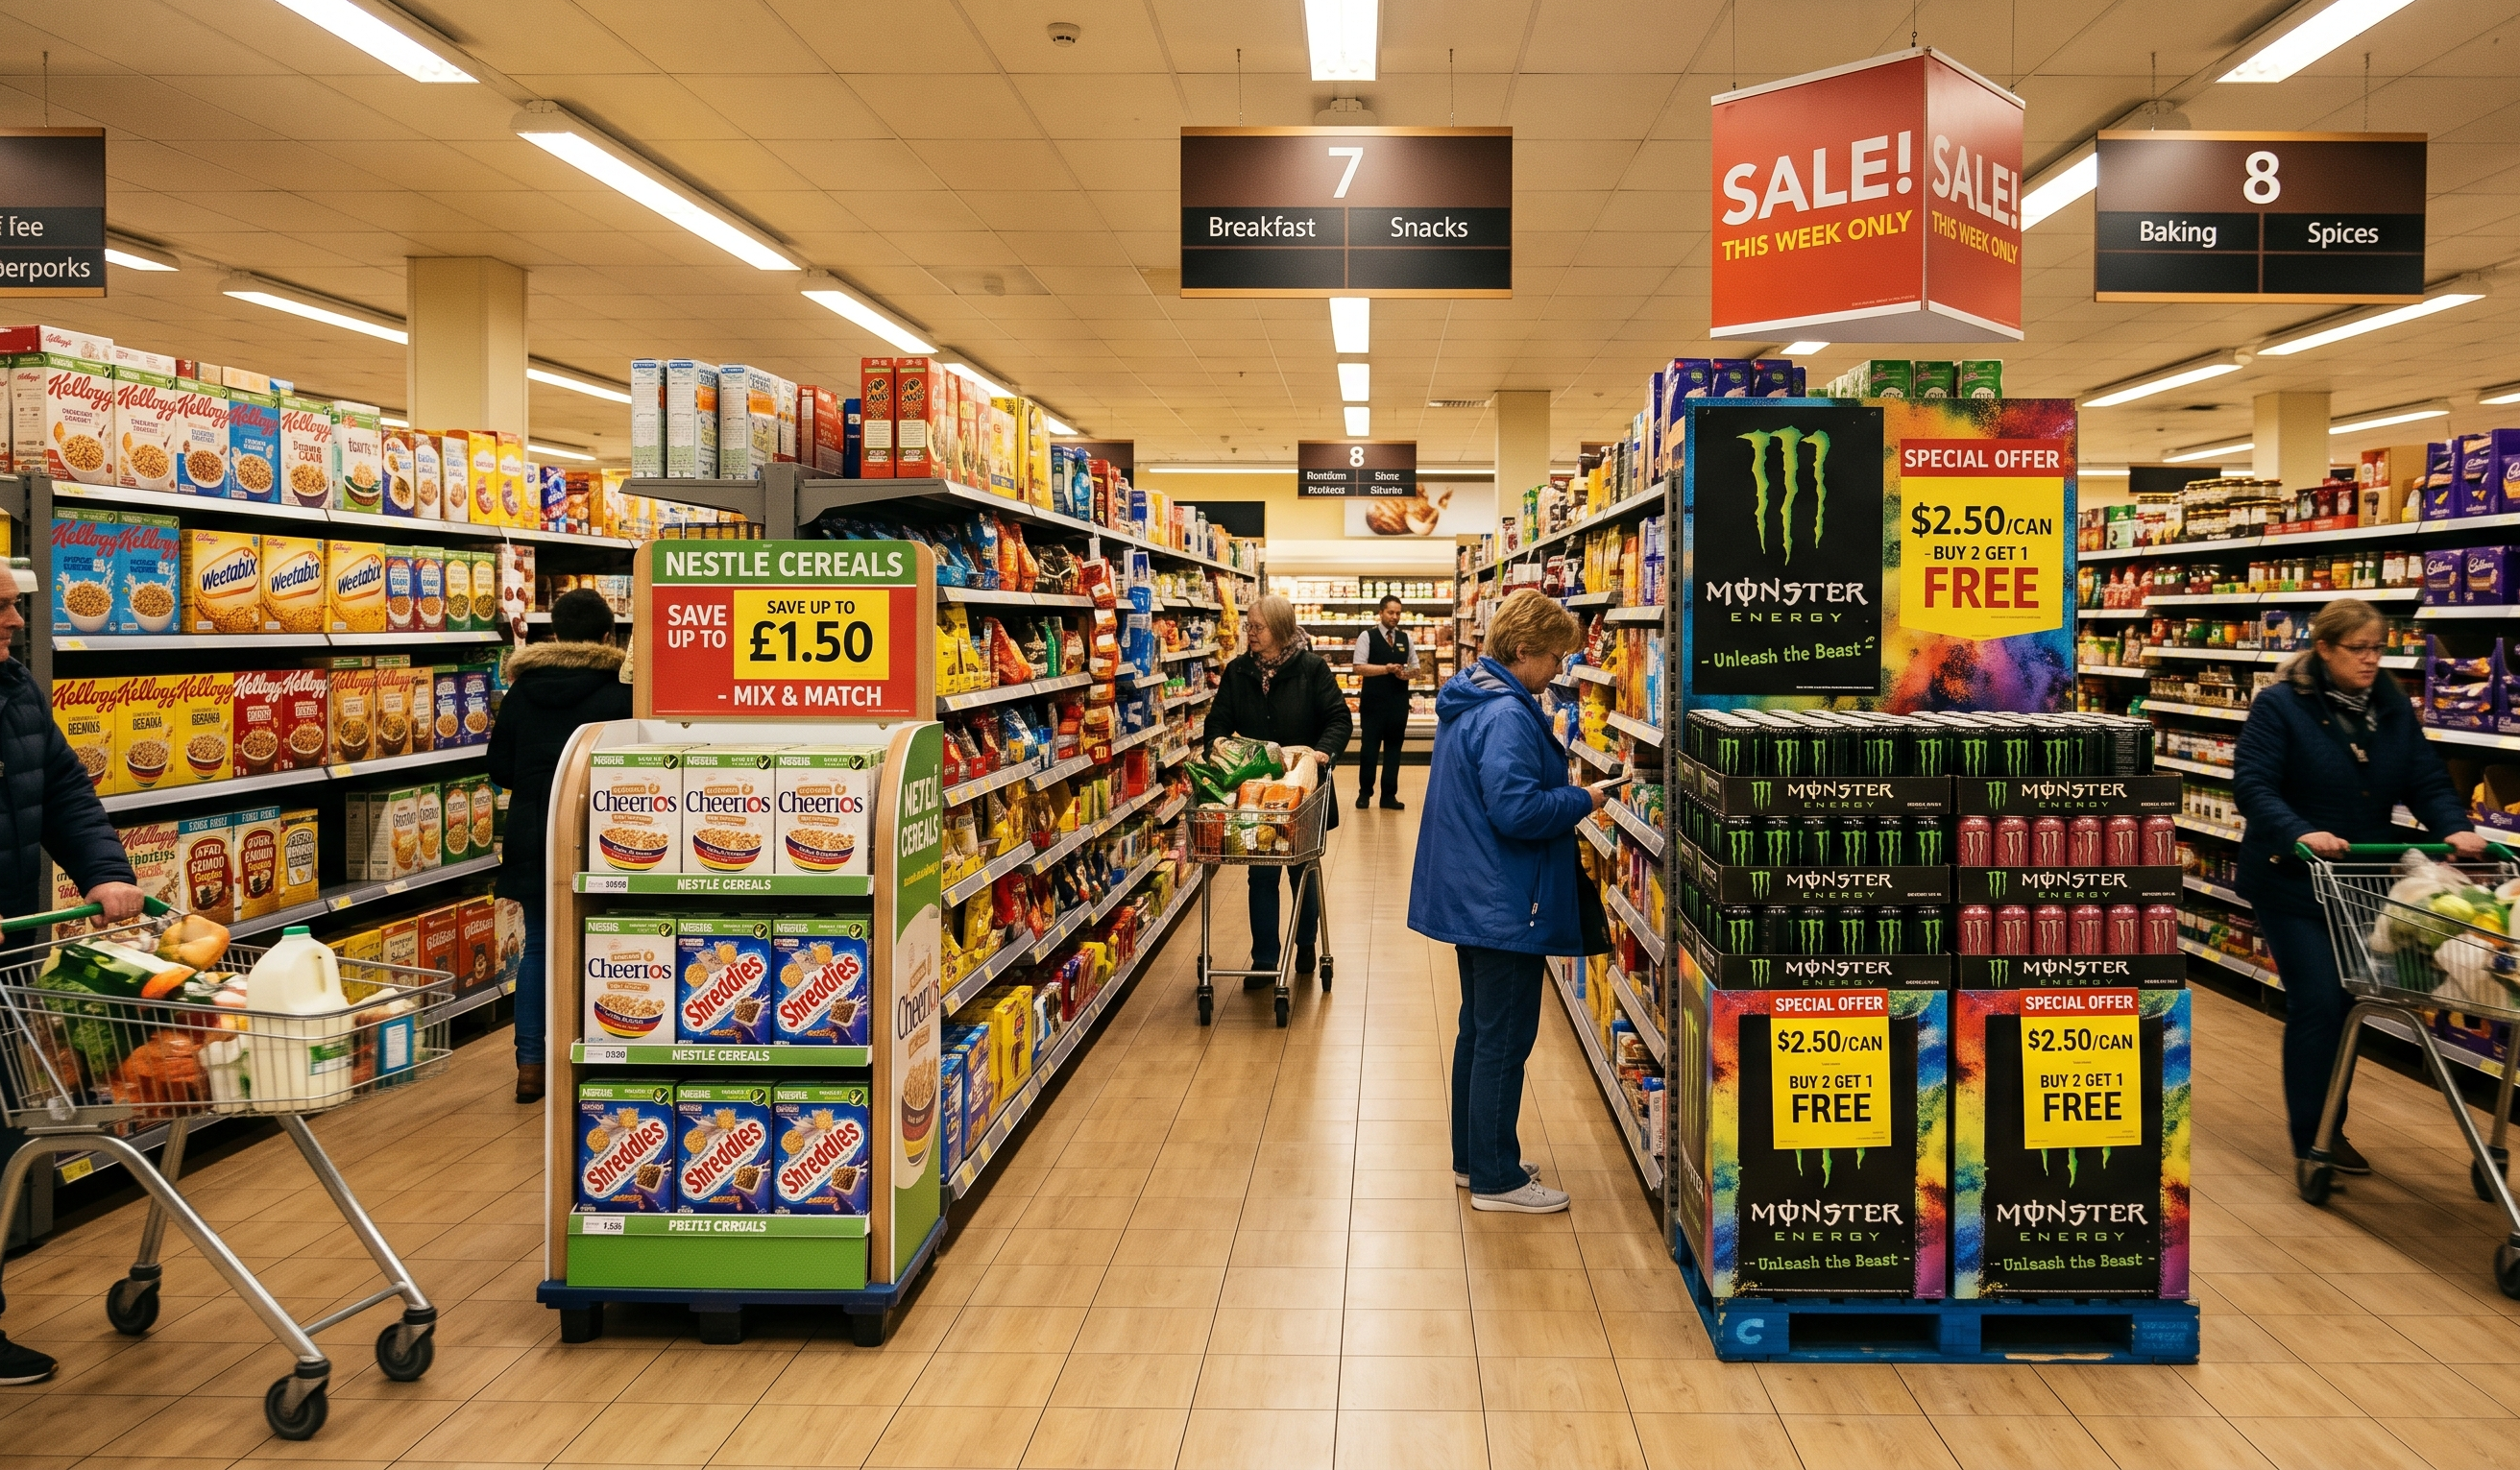
Supermarket aisle with competing branded promotional end-cap displays
Trade in the aisleEvery end cap and feature is a trade investment. Execution data shows which ones actually went up, at the agreed price and prominence.
Q1

Which accounts delivered the best execution compliance?

Q2

Which standards correlated most strongly with sell-through improvement?

Q3

Where did compliance gaps reduce the effectiveness of the promotion?

Q4

What was the revenue impact of a 15% execution shortfall in the top 50 stores?

These questions are now answerable and the answers change how the next promotion is planned, priced and resourced.

Connecting execution data to RGM systems.

The most strategically significant applications connect shelf data to Revenue Growth Management systems and commercial analytics platforms.

Promo effectiveness modelling

Promotions evaluated not just on sell-through, but on the execution conditions that enabled or limited it. The model becomes more accurate and more useful.

Price architecture validation

Shelf-level pricing data provides a continuous check on whether the brand's price architecture is being maintained, including competitor dynamics.

Volume decomposition

Separating base volume from promotional lift becomes more accurate when execution conditions are known. A 60% compliance period is not directly comparable to a 95% one.

Marketing mix modelling

Execution quality becomes a new input into Marketing Mix Models (MMM), adding store-level execution data that has historically been missing from these models.

Assortment, competitive intelligence and product launches.

Assortment optimisation

Knowing a product was physically present on shelf is critical context before any delist decision, preventing removal of SKUs that were listed but simply never executed.

Competitive intelligence

A brand monitoring its own execution gathers continuous data on competitor pricing, promotional frequency and compliance and share-of-shelf movements.

Product launch tracking

New SKU launches monitored from day one for distribution, shelf placement and competitive response. The launch window is finite, visibility changes the odds.

Launch tracking

Watch a launch land, store by store.

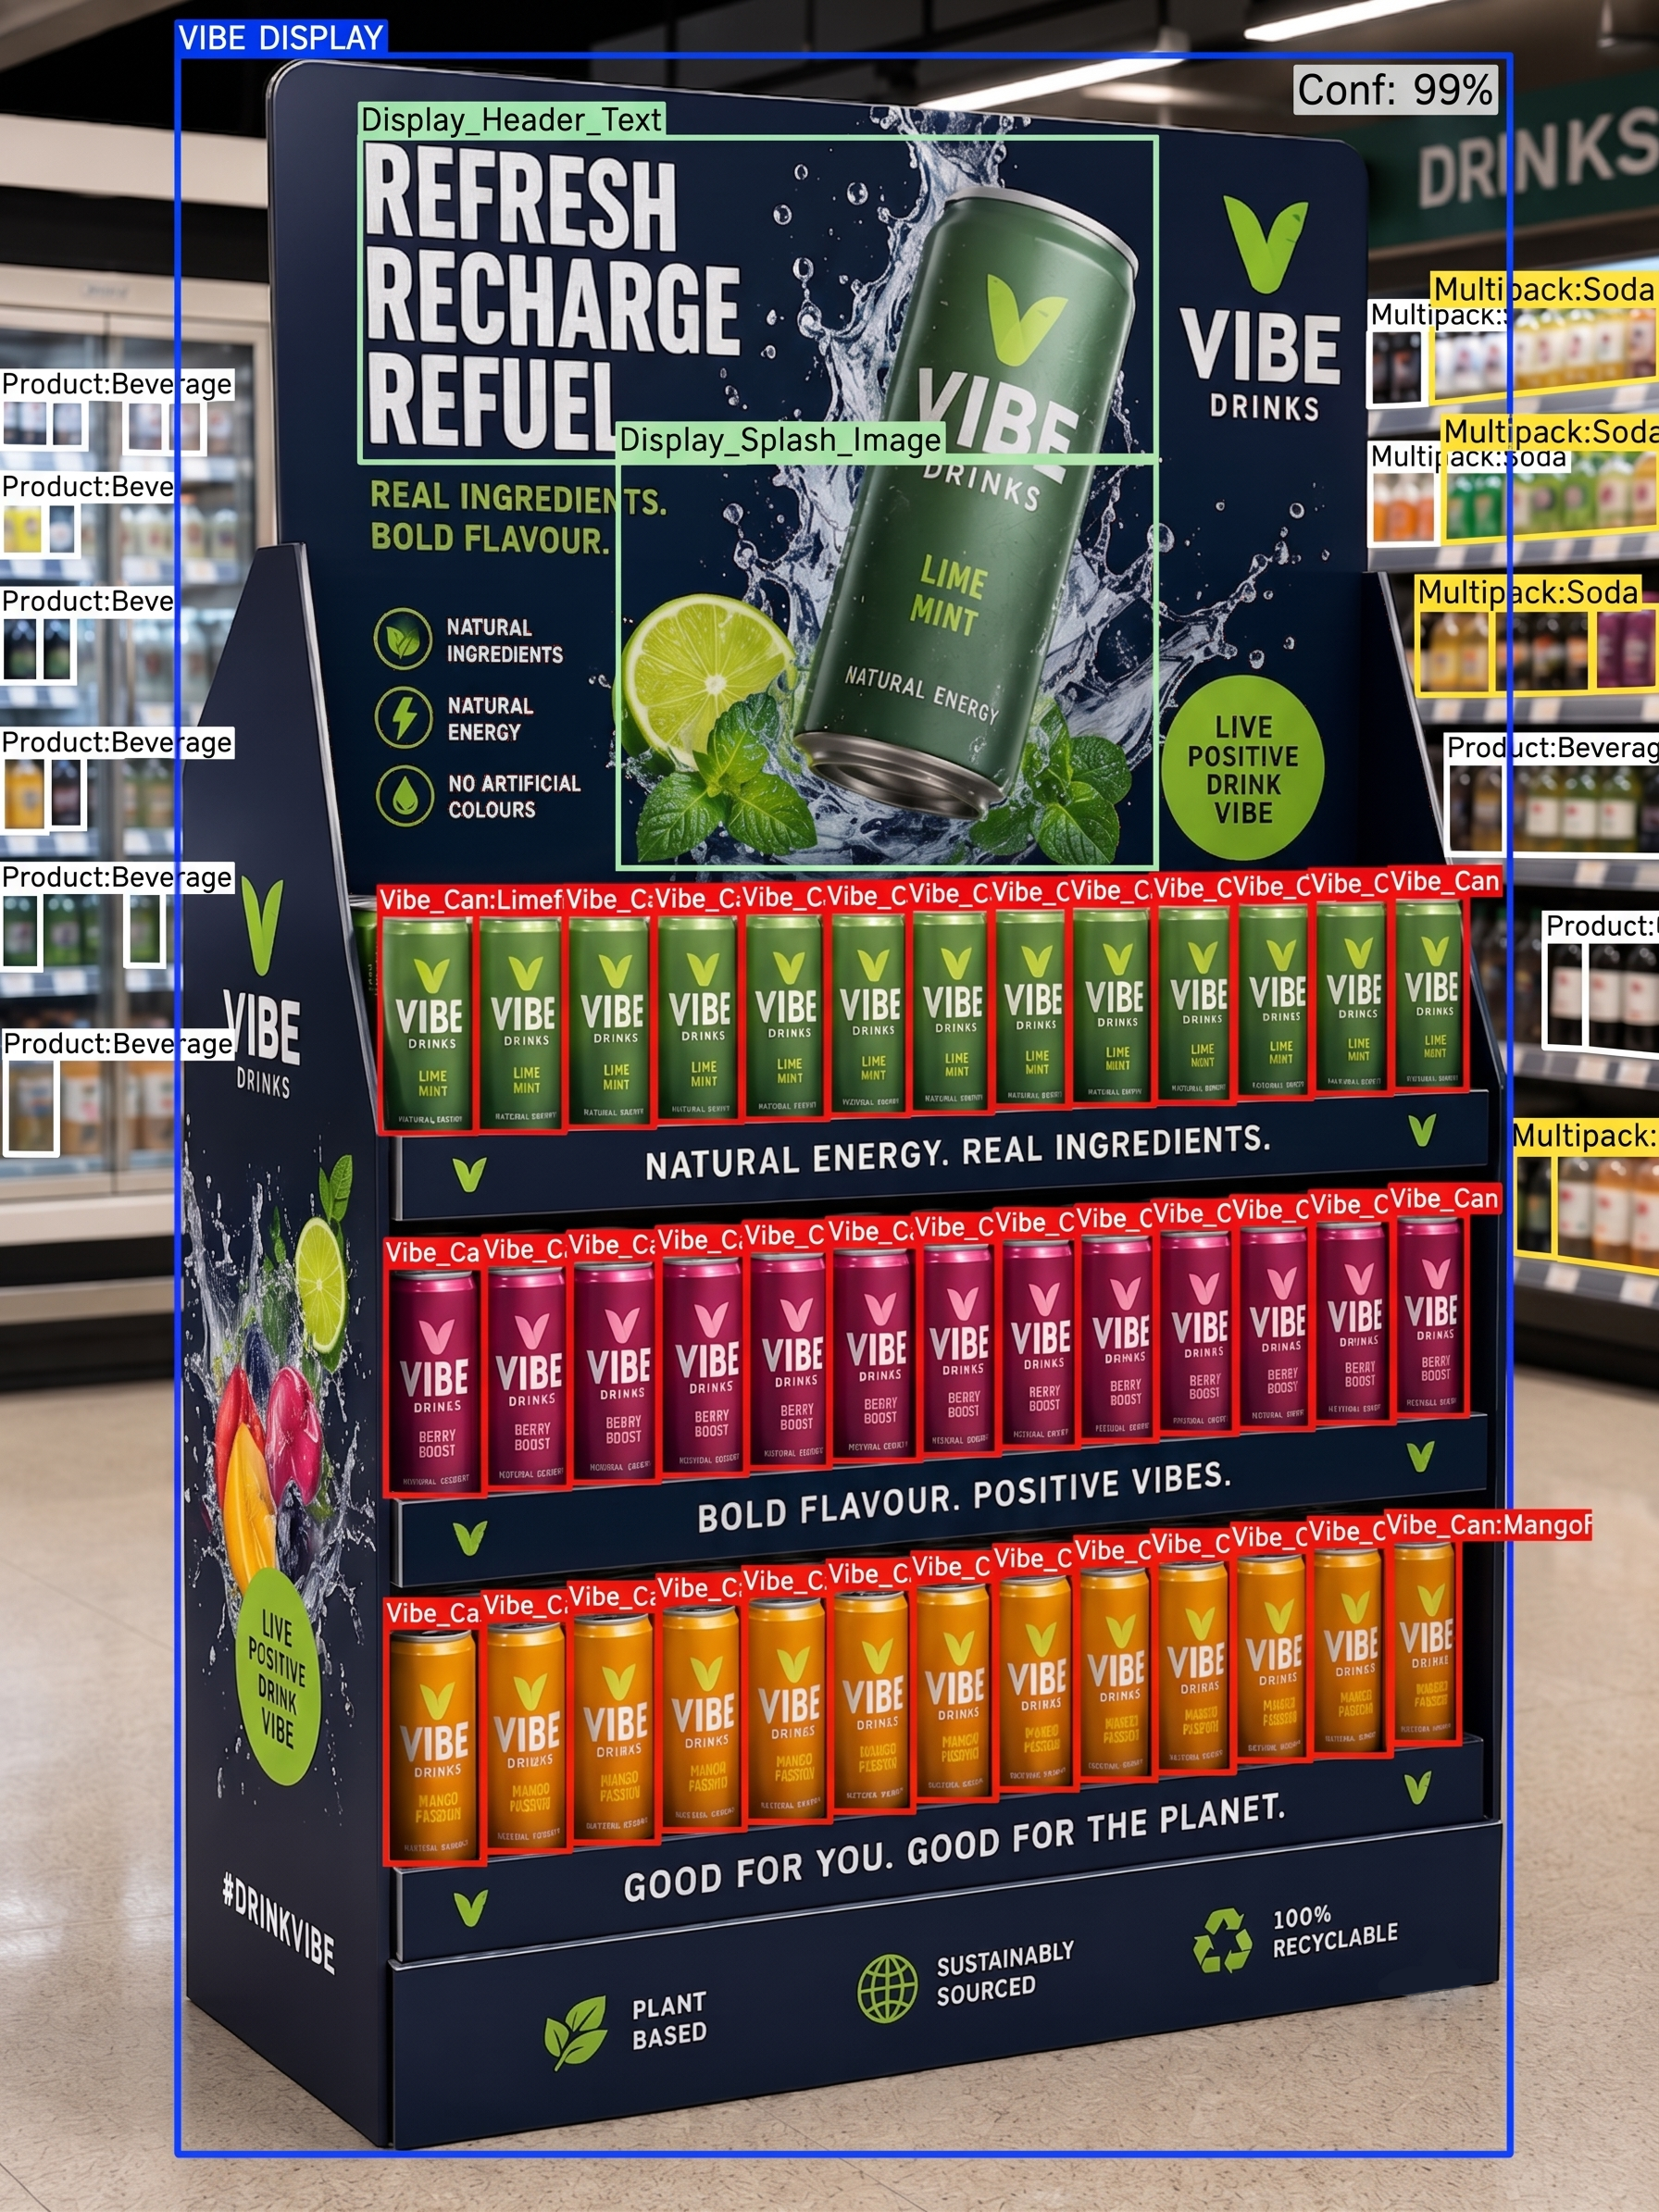
A new range lives or dies on its first weeks of distribution and placement. Execution data confirms the display went up where it was booked, and flags the stores where it did not, while the launch window is still open.

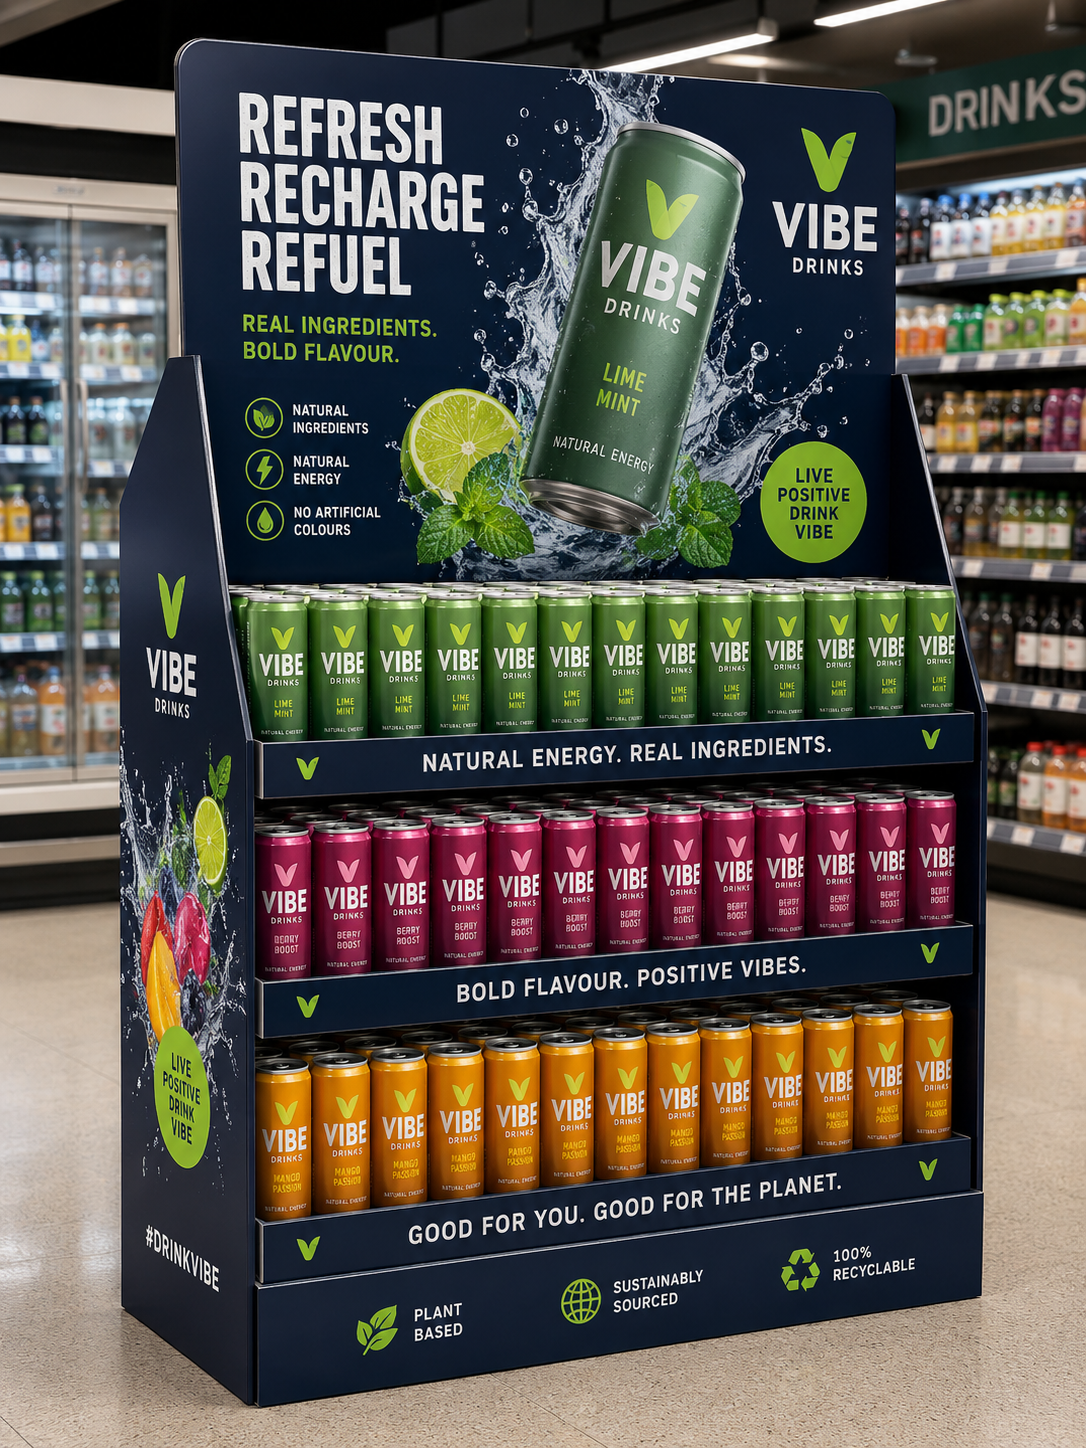
A branded free-standing display unit for a drinks launch in-store
As merchandisedThe display as the shopper sees it.
The same display with the unit, header, splash image and every can identified
As readThe same photo, with the display, header and every facing identified.
Chapter 07 Execution Intelligence in practice

Real brands. Measurable outcomes.

Commercial impact you can take to the CFO. Two deployments, a leading UK soft drinks portfolio and a pharmacy recognition launch delivered in seven days.

AG Barr multi-pack display stack with products and promotion sign detected
Case study · Soft drinks

AG Barr

Outcome
Turning audit time into selling time.

AG Barr is one of the UK's leading soft drinks companies, home to Irn-Bru, Rubicon, Fever-Tree and more. With significant retail presence across grocery, convenience and on-trade, maintaining shelf quality while maximising selling time was the commercial imperative.

Before Neurolabs, reps conducted manual shelf audits consuming 45+ minutes per store. Data was aggregated by territory managers and reviewed days later, well after the actionable window had closed.

50% Faster store audits per visit
300+ SKUs digitised for instant recognition
+96% Accuracy in shelf data capture
"Neurolabs transformed our field operations, faster, more accurate and fully digitised. Our reps spend more time selling and we have greater confidence in our data."
Keir Stewart, Head of Performance Analytics, AG Barr
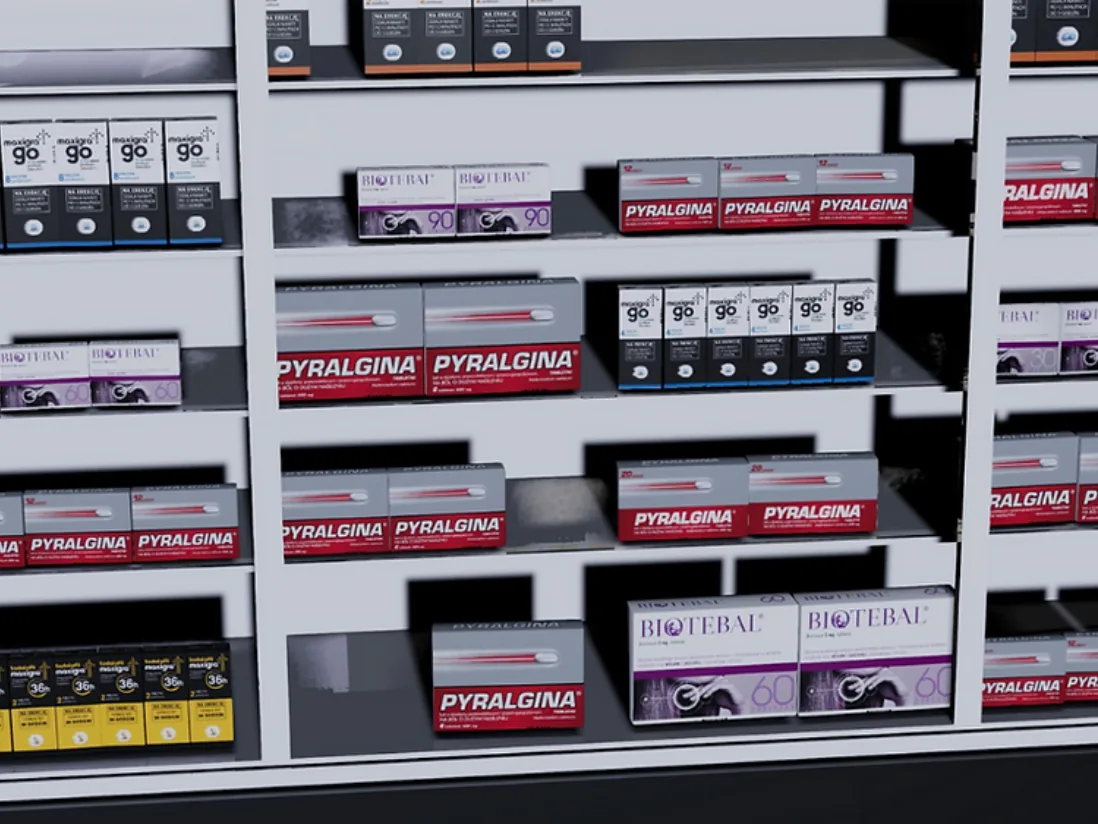
Near-identical pharmaceutical packs on a pharmacy shelf recognised and differentiated by dose count
Case study

Sagra Technology

Outcome
From onboarding to delivery in seven days.

Sagra Technology builds mobile software for sales, marketing and analytics, embedded in its Emigo SFA system. For a pharmacy client it faced a hard recognition problem: 25 near-identical pharmaceutical packs that differed only by dose count, with reps needing accurate results during the store visit itself.

Traditional image recognition struggled on both counts, minor packaging differences are hard to tell apart, and preparing a model the classic way is slow and data-hungry. Neurolabs' ZIA (Zero Image Annotation) trained on synthetic 3D digital twins instead of hand-annotated photos, learning each pack from millions of angles. Sagra sent PDF label images for all 25 SKUs; from onboarding to delivery took seven days, against a market standard of weeks.

7 days Onboarding to project delivery
98.3% Product detection accuracy
~5 sec Average result time in store
"Neurolabs' ZIA technology has been a true game-changer for us. Its synthetic data approach to IR, as well as the way of model creation and new SKU onboarding, has revolutionised our operations."
Sagra Technology
Chapter 08 The Retail Execution Maturity Model

Where is your organisation on the journey to Execution Intelligence?

The transition from manual execution management to full Execution Intelligence is not a single step, it is a progression. Most CPG organisations are somewhere along this journey. Understanding where they sit is the starting point for identifying where to invest next.

Stage 01

Manual Execution

  • Rep-led shelf visits only
  • Paper or basic digital forms
  • Data reviewed weekly
  • No image capture
Execution failures found weeks later, or not at all.
Stage 02

Basic Image Recognition

  • Automated SKU detection
  • Simple planogram checks
  • Faster audit completion
  • Siloed from commercial tools
Faster data, but still used operationally, not commercially.
Stage 03

Connected Execution Data

  • Data in commercial dashboards
  • Trade promo effectiveness measured
  • Account benchmarking live
  • Exception-based alerting active
Organisation answers "what happened?", but still reactive.
Stage 04 · Target

Execution Intelligence

  • Near real-time full-estate monitoring
  • Predictive execution risk identification
  • Automated inventory response
  • Full RGM integration
  • Competitive intelligence as by-product
Failures corrected inside the window. Trade ROI validated in near real time.
From Stage 3 to Stage 4

Less about technology. More about operating model.

Many organisations reach Stage 3, connected execution data and believe they have arrived. They have dashboards. They have compliance data. They can answer "what happened?" with reasonable speed.

What they cannot yet do is predict where execution will fail before it does, connect execution quality directly to individual revenue outcomes, or use that connection to improve the next commercial cycle. Those capabilities define Stage 4.

The transition requires treating execution data as a commercial asset, not an operational record and building the analytical connections to RGM, trade planning and commercial analytics that make the data genuinely valuable.

Stage 4 is not about having more data. It is about having the right data, connected to the right decisions, at the right moment. That is Execution Intelligence.
Chapter 09 The future of retail execution

The brands investing in execution data today are building the commercial intelligence infrastructure for the next decade.

The shift from manual execution management to Execution Intelligence is not the end of the journey. The organisations that reach Stage 4 today will have a significant head start on the next generation of capabilities, the ones that will define competitive advantage in CPG for years ahead.

Horizon 01

AI-Driven Execution.

AI systems trained on years of execution outcomes will predict execution risks before they materialise, identifying stores, accounts and promotional periods where failure is statistically probable. Preventative execution management becomes standard.

Horizon 02

Connected CPG Ecosystems.

The full value is realised when execution data flows seamlessly across the CPG technology stack, Salesforce CG Cloud, Databricks, TPM and RGM platforms. As integrations mature, the execution gap closes across the full planning cycle.

Horizon 03

Predictive Execution.

Volume decomposition models will incorporate execution quality as a standard variable. Promo effectiveness conditioned on compliance. Marketing mix models will finally include the execution variable historically unmeasurable. The data built today trains these models.

A photorealistic rendered store shelf used to train product recognition
Trained ahead of the shelfRecognition is built in rendered store environments, so a product is known from the day it is designed, before it reaches a single real shelf.
The integration imperative

A shared language between brands and retailers.

The relationship between CPG brands and retailers is changing. Retailers are increasingly interested in sharing execution accountability, aligning incentives around in-store performance rather than negotiating terms and hoping for the best.

Execution Intelligence creates a shared language for that conversation. When brands can show retailers objective, near real-time data on execution compliance and connect it to commercial outcomes, the basis for a more accountable, more productive trading relationship is established.

The brands best positioned for those conversations are the ones with the most credible execution data infrastructure. Building that capability now is not just an operational investment. It is a strategic one.

The next generation of commercial advantage in CPG will belong to the brands that can answer: did our execution drive revenue? And act on the answer in real time.
In closing The Execution Intelligence Loop

Every store visit generates data. Every action drives a measurable outcome.

The loop is continuous, self-reinforcing and compounding. That is the structural advantage Execution Intelligence creates.

01

Visit → Data

Every store visit generates a structured feed of shelf reality.

02

Data → Insight

Every data point becomes a structured commercial insight.

03

Insight → Action

Every insight enables an action while the window is still open.

04

Action → Outcome

Every action drives a measurable outcome, which improves the next visit.

Start closing the execution gap

See Everything.
Miss Nothing.

The retail execution gap is measurable. And for most brands, it is still largely invisible. Promotions run without verification. Displays go up incorrectly. Products disappear from shelves without triggering replenishment. Execution Intelligence changes that.

Live in weeks, not months across the full store estate.
Visibility into availability, pricing, promotions and display while campaigns are still live.
Synthetic data eliminates SKU onboarding bottlenecks.
Native integration with Databricks and commercial analytics platforms.